The AdWords Monitor is an in-depth analysis tool for researching the top competitors for paid ads by utilizing an Ad Monitor Graph and the actual advertising content.
This AdWords tool is located in the Reports & Tools > Paid Search > Competitive Insights section of Rank Ranger.
- SEO
- Rank Tracker
- Local SEO
- Mobile SEO
- Link Manager
- Landing Pages
- Social Signals
- On-Page Optimization
- Enterprise SEO Solutions
- Marketing
- Competition Analysis
- Insight Graph
- Keyword Research
- Graphs & Widgets
- Market Reach
- Marketing KPI
- Brand Visibility
- White Label SEO
- Marketing Dashboard
- Client Dashboard
- PDF Reports
- PDF Templates
- Other
- Email Notifications
- Portfolio Management
- Integrations
- Google Analytics
- Search Console
- Pay Per Click
- WeDevelop
- API
Ads Monitor
Paid Results Analysis
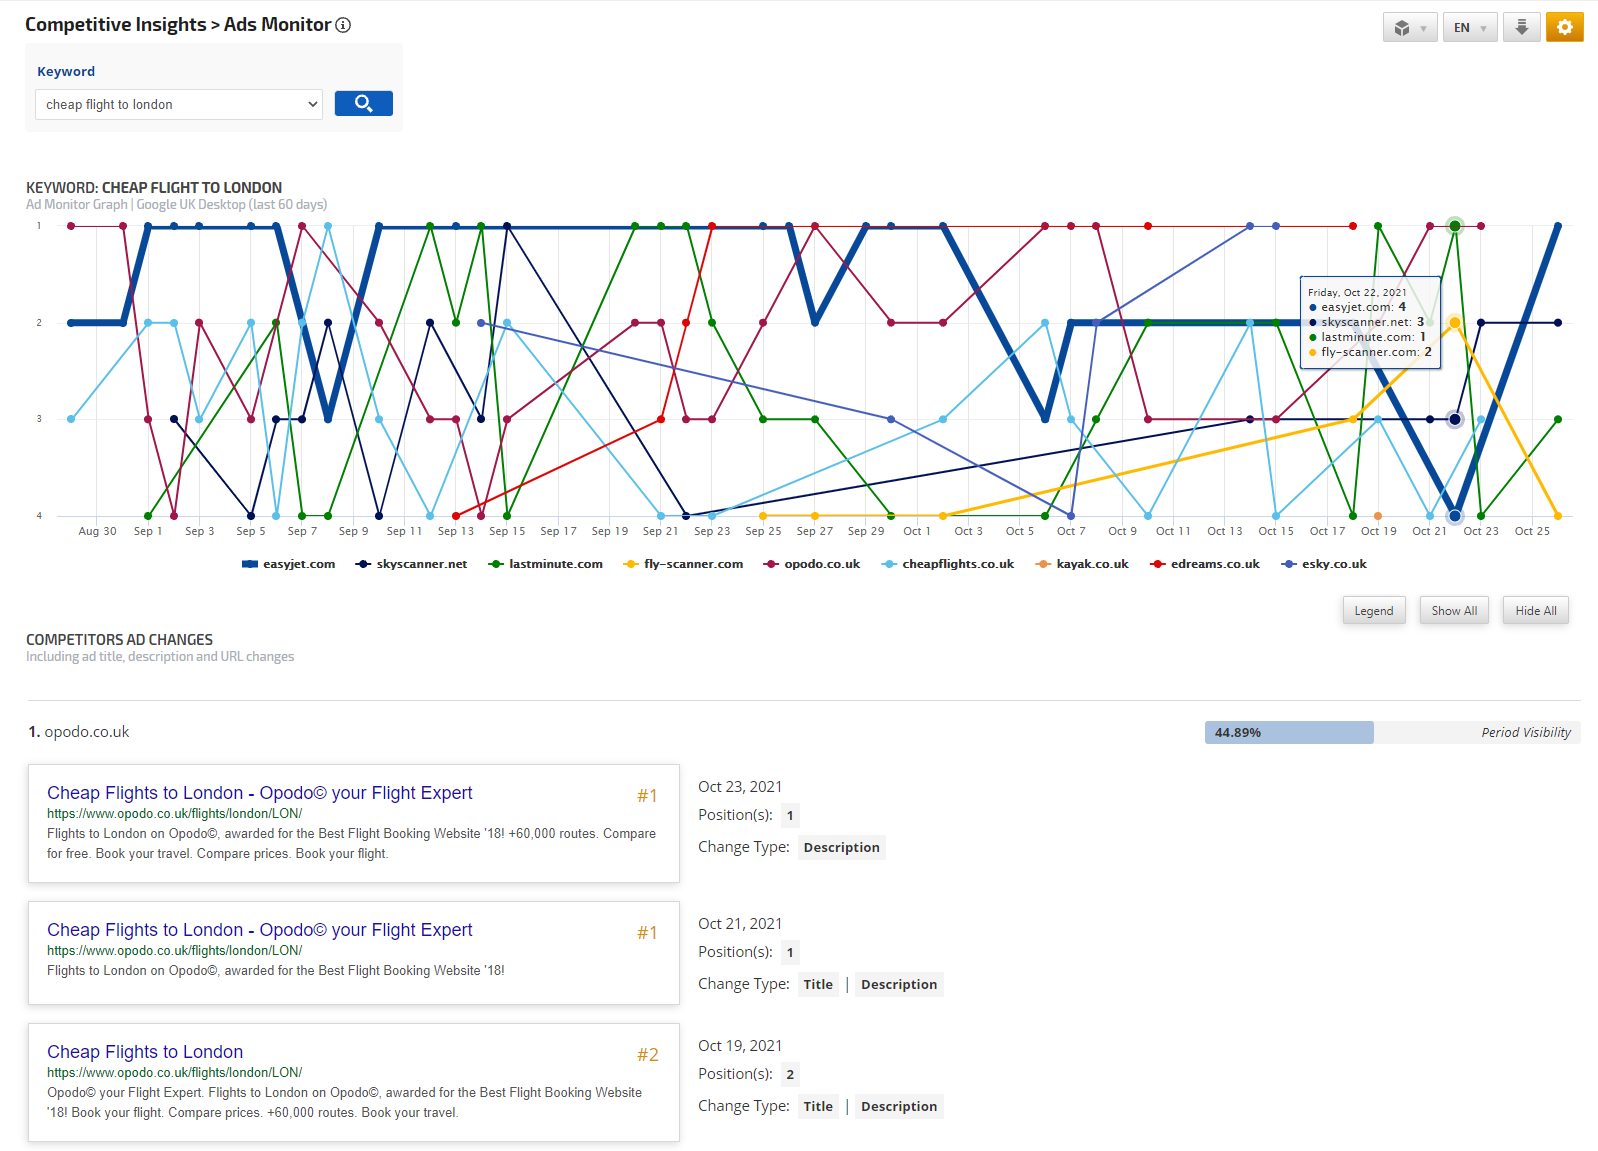
The Ad Monitor Graph provides a colorful analysis of competitor ads for the previous 60 days. Below that you'll find a Competitors' Ad Change report that details the Ad title, content, landing page, and paid ad placement positions for the selected keyword. A change highlight feature makes it easy to view the type of change that occurred in paid ads displayed in the search results between one day and the next (e.g., ad title or content change, landing page URL change).
The Ad Monitor Graph provides a colorful analysis of competitor ads for the previous 60 days. Below that you'll find a Competitors' Ad Change report that details the Ad title, content, landing page, and paid ad placement positions for the selected keyword. A change highlight feature makes it easy to view the type of change that occurred in paid ads displayed in the search results between one day and the next (e.g., ad title or content change, landing page URL change).
Top Competitor Analysis
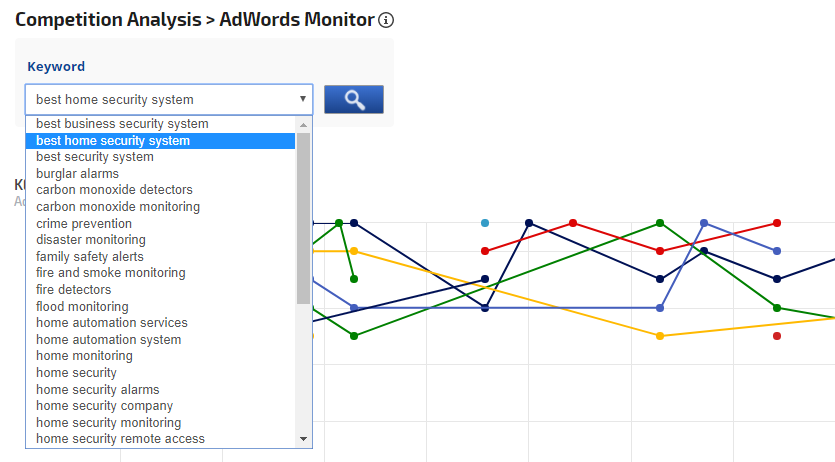
This graph displays the top advertisers, along with their ad positions, competing for 1 keyword over a 60 day period.
Top Competitors displayed with Combined Metric Hover (displays all competitors for the selected date) and full Legend enabled
This graph displays the top advertisers, along with their ad positions, competing for 1 keyword over a 60 day period.
Top Competitors displayed with Combined Metric Hover (displays all competitors for the selected date) and full Legend enabled
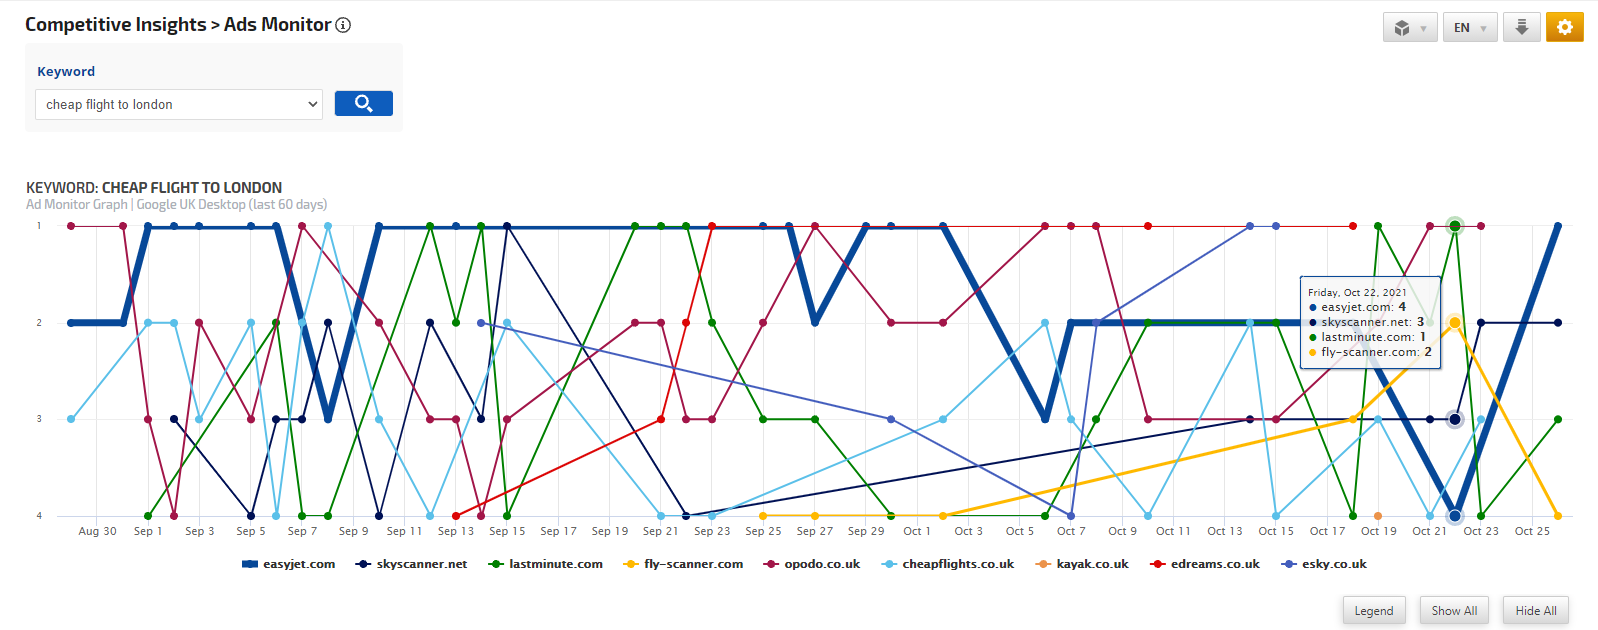
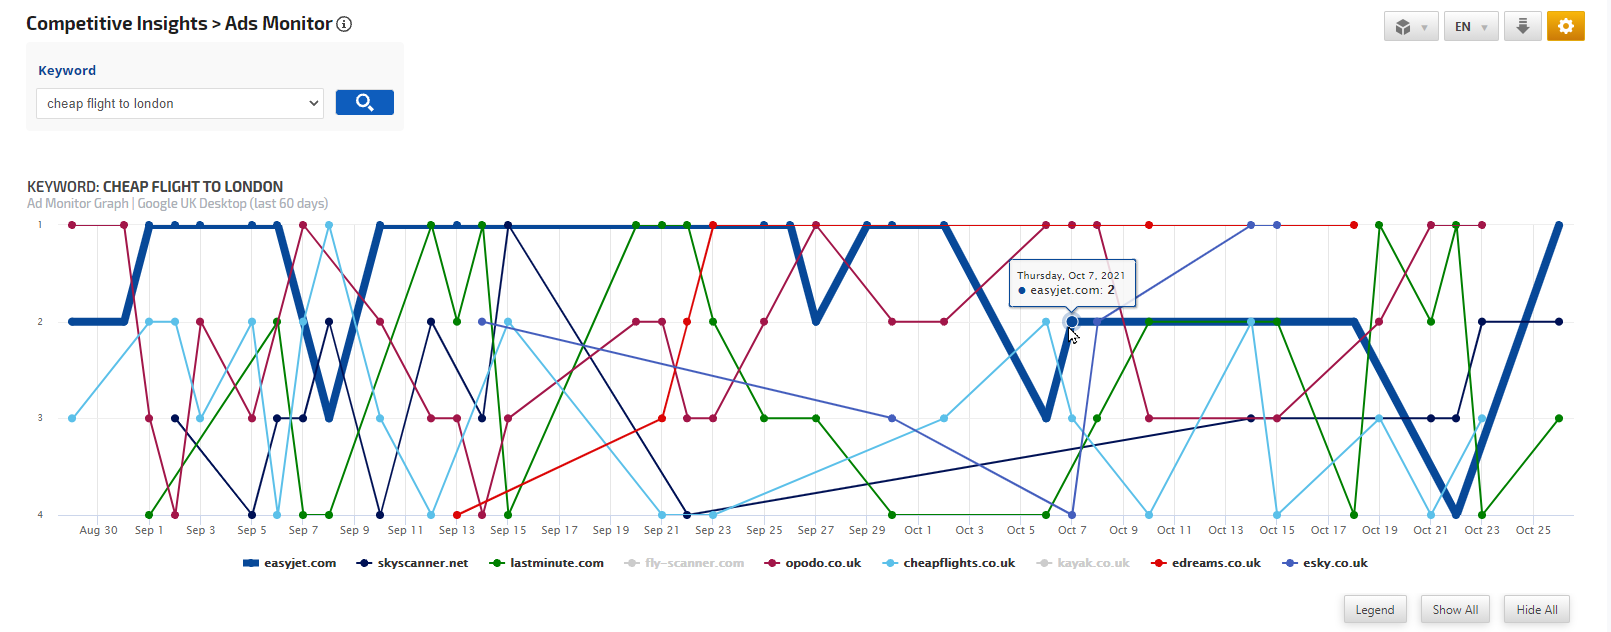
Filter Results
In this example, we've set the Metric Hover to display a single competitor at a time when hovering over a point in the graph. And while viewing the results, we've removed some of the competitors by clicking their site name in the Legend, to filter out the competitors whose ad made it to page one only a few times during a 60 day period. The buttons Show/Hide All enable the user to select or unselect all domains listed in the Legend option and displayed in the chart.
In this example, we've set the Metric Hover to display a single competitor at a time when hovering over a point in the graph. And while viewing the results, we've removed some of the competitors by clicking their site name in the Legend, to filter out the competitors whose ad made it to page one only a few times during a 60 day period. The buttons Show/Hide All enable the user to select or unselect all domains listed in the Legend option and displayed in the chart.
Ad Content & Position Analysis
Each Ad Snapshot includes the ad title, landing page URL, ad content text, and the ad rank position.
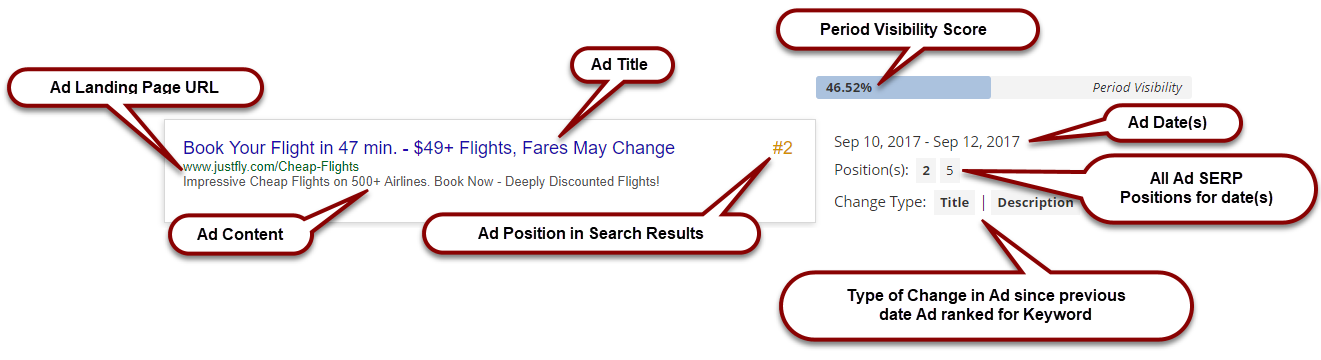
To the right of the Ad Snapshot is the:
Each Ad Snapshot includes the ad title, landing page URL, ad content text, and the ad rank position.
To the right of the Ad Snapshot is the:
- Period Visibility score for the 60-day period comparing the strength of the domain vs. the other competitors in terms of ad placement and occurrence.
- Ad rank date, or date range if the same domain had an ad display for more than one day for the keyword
- Additional positions that the Ad ranked for the keyword on that date (if applicable), clicking on a position reveals the Ad that displayed in that position
- Type of change that occurred in the Ad between the rank date and the previous rank date, clicking on a change type highlights the change
Analyze Day to Day Ad Changes
Hover over a Change Type (e.g., Description or URL) to highlight the change between the current date and a previous date for the same advertiser. In this example we've hovered over a few of the changes to demonstrate the highlight feature:
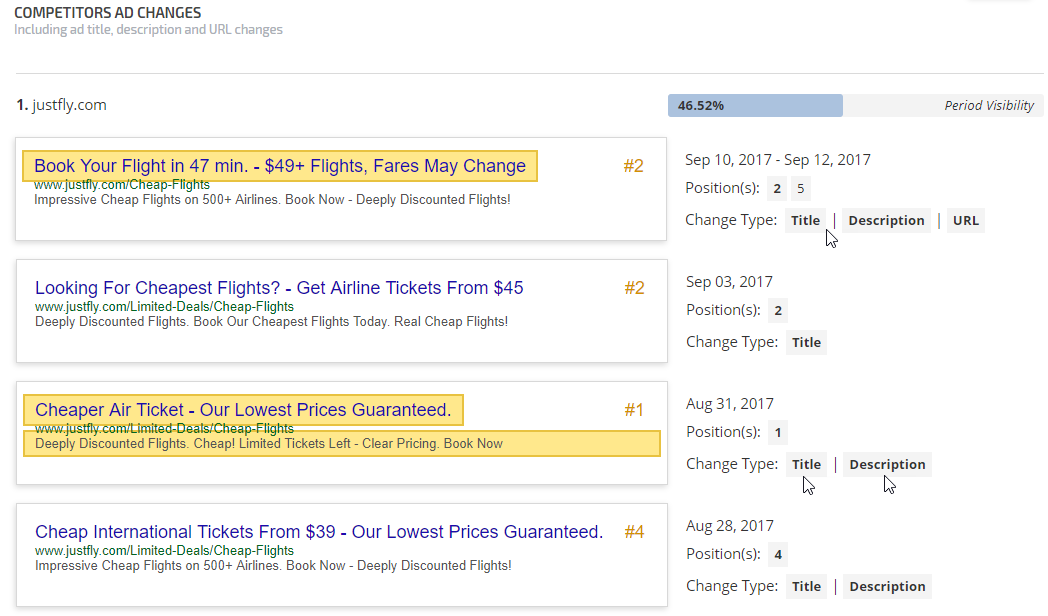
Hover over a Change Type (e.g., Description or URL) to highlight the change between the current date and a previous date for the same advertiser. In this example we've hovered over a few of the changes to demonstrate the highlight feature:
- The Ad Title changed between Sep 3 and Sep 10
- The Ad Title and Description changed between Aug 28 and Aug 31
Multiple Ad Positions for the same competitor
The Competitor Ad Changes report is interactive and provides options for the discovery of the title, link, description, and multiple ad placement positions for the site advertised for the tracked keyword. In this example, the keyword has ranked in positions 2 and 5 for different target landing pages and with different ad copy.
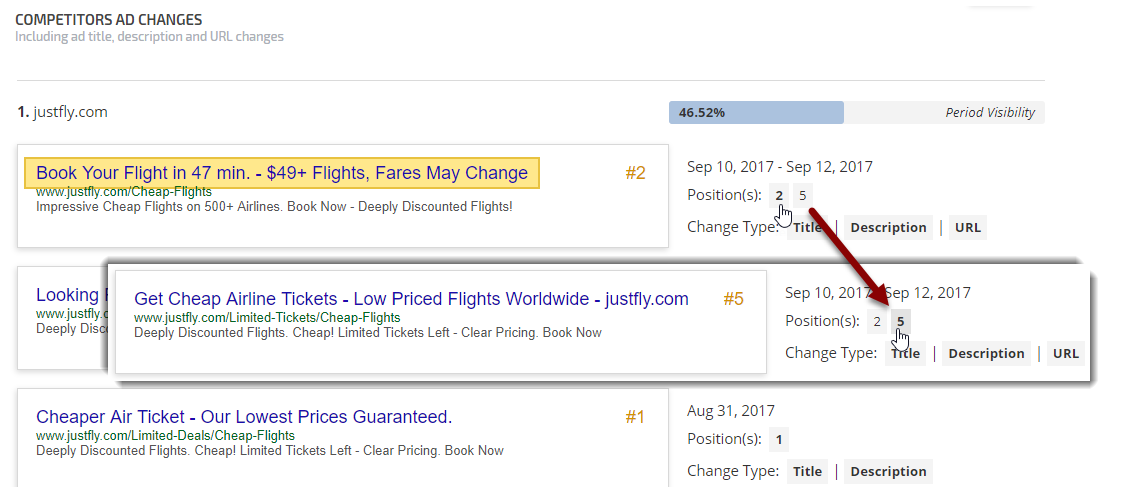
The Competitor Ad Changes report is interactive and provides options for the discovery of the title, link, description, and multiple ad placement positions for the site advertised for the tracked keyword. In this example, the keyword has ranked in positions 2 and 5 for different target landing pages and with different ad copy.
Select a campaign keyword to base the competitor report on, and click the search icon
 |
General Settings
|
 |
Search Engine
|
 |
Chart Settings
|
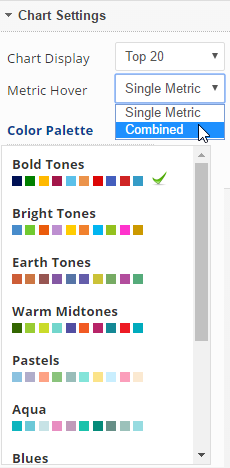 |
Metric Hover
Click the Apply Changes button |
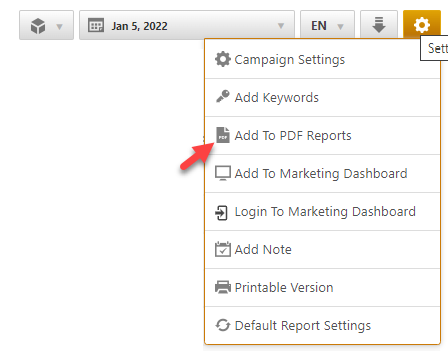
Add to PDF Report
Conveniently add a report or graph with its current settings to a PDF report by hovering over the gold gear icon and selecting Add to PDF Reports
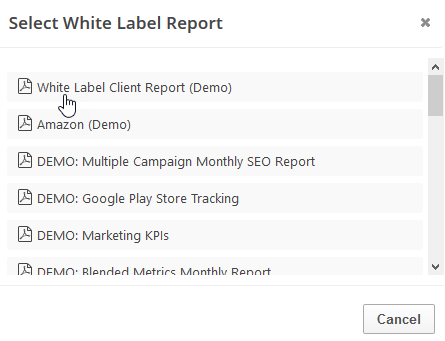
Select the PDF Report that you want the report or graph added to
Drag the new report or graph into the position you want it to display in the PDF and confirm that the Date settings do not conflict with the automated scheduling settings.
Add to Marketing Dashboard
Conveniently add a report or graph with its current settings to a marketing dashboard:
1. Hover over the gold gear icon and select Add to Marketing Dashboard
2. Select the Dashboard (campaign name)
3. Select the Dashboard Page that you want the report added to

1. Hover over the gold gear icon and select Add to Marketing Dashboard
2. Select the Dashboard (campaign name)
3. Select the Dashboard Page that you want the report added to
4. Click the "Go to Dashboard" link to further customize the report (e.g., drag it to a specific position on the page, change date settings, etc.)

Refer to the Report Options section for details regarding the display settings, filters and sort options available for this report.
The report date (or date range) is governed by the selected Dashboard date option: Date Selection or Fixed Periods, learn more...
- Daily reports default to the last day of the selected period
- Weekly and monthly reports default to 1 month of data
Add to Client Dashboard
Customize Report for Client Dashboard
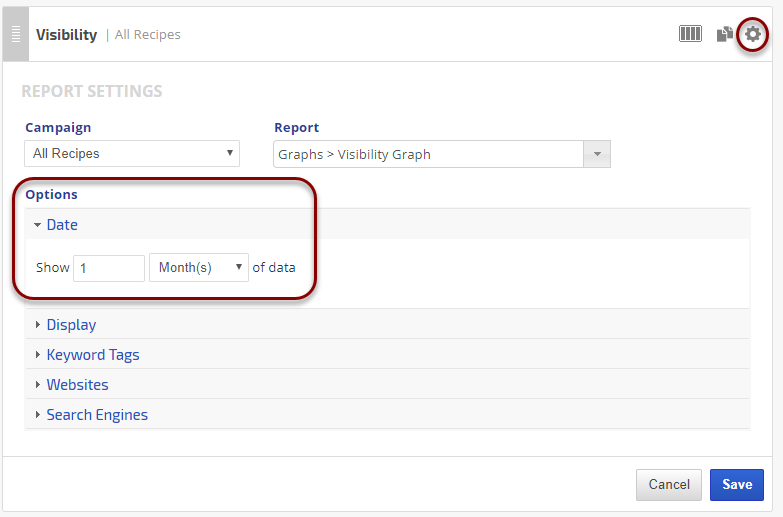
Client Dashboards display our default report options for each individual report and graph until you modify them. To customize the display of the report, expand the Report Options section, change the settings and click the Apply Changes button.
Then expand Report Options again and hover over the Save icon and select Save as Default for Client Dashboard.
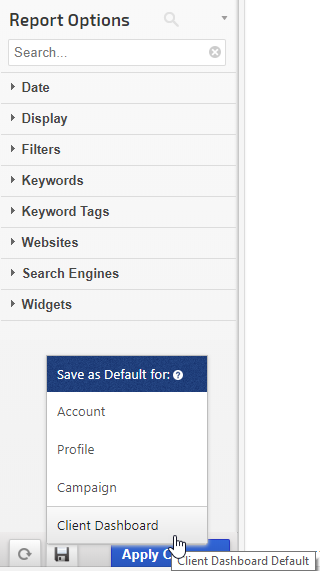
After saving the Client Dashboard default, any changes that you make to the report options will not affect the display in the Client Dashboard unless you overwrite it by following these instructions again.
Client Dashboards display our default report options for each individual report and graph until you modify them. To customize the display of the report, expand the Report Options section, change the settings and click the Apply Changes button.
Then expand Report Options again and hover over the Save icon and select Save as Default for Client Dashboard.
After saving the Client Dashboard default, any changes that you make to the report options will not affect the display in the Client Dashboard unless you overwrite it by following these instructions again.
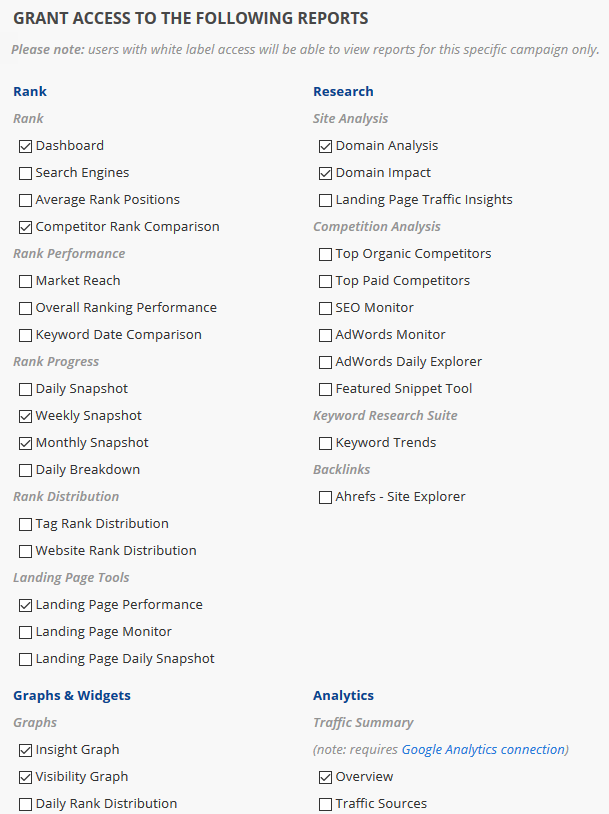
Enable the Report or Graph to display in the Client Dashboard
Open the Campaign Settings > Client Dashboard screen and check the box corresponding to the report(s) you want displayed in the dashboard, and then click the Save button.
Open the Campaign Settings > Client Dashboard screen and check the box corresponding to the report(s) you want displayed in the dashboard, and then click the Save button.
Refer to Client Dashboard Settings documentation for additional instructions for customizing your dashboard.