The Bing Ads Keywords report provides data on the performance of keywords in the Bing Ad account that has been connected to the domain's campaign in Rank Ranger.
The report includes a graph showing the results associated with the Key Metric you select (clicks, impressions, CTR, or spend) at the top of the report as well as a variety of keyword performance metrics displayed in tabular format.
The graph and tabular presentations of Bing ads data can be either displayed or hidden based on the user's preference, and like all Rank Ranger reports, the report can be added to client dashboards, marketing dashboards, or automated PDF reports that are sent by email.
Important! In order to view this report, you must authorize a connection to a Bing Ads account.
- SEO
- Rank Tracker
- Local SEO
- Mobile SEO
- Link Manager
- Landing Pages
- Social Signals
- On-Page Optimization
- Enterprise SEO Solutions
- Marketing
- Competition Analysis
- Insight Graph
- Keyword Research
- Graphs & Widgets
- Market Reach
- Marketing KPI
- Brand Visibility
- White Label SEO
- Marketing Dashboard
- Client Dashboard
- PDF Reports
- PDF Templates
- Other
- Email Notifications
- Portfolio Management
- Integrations
- Google Analytics
- Search Console
- Pay Per Click
- WeDevelop
- API
Bing Ads Keywords Performance

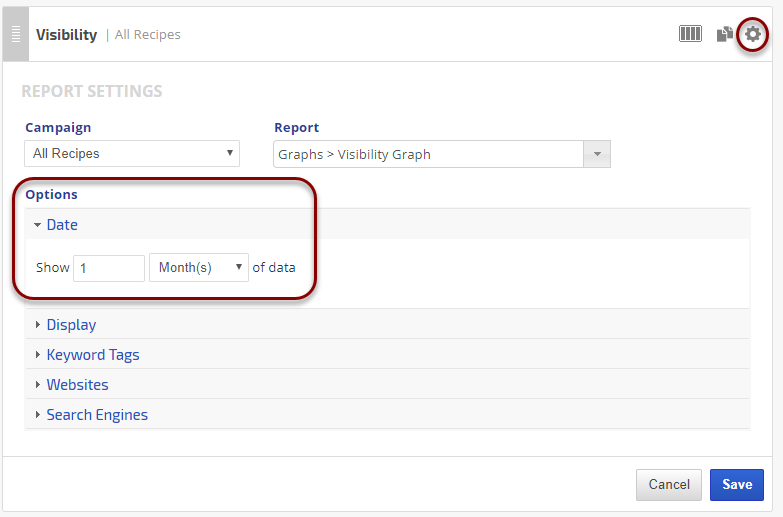
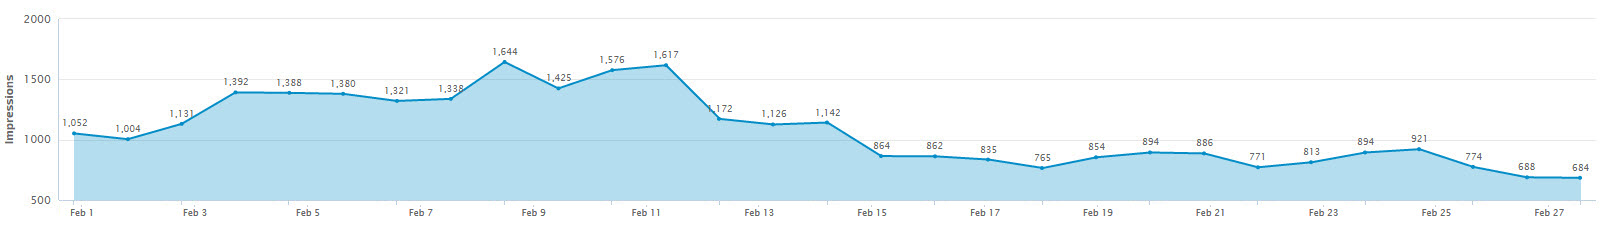
The Bing Ads Keywords Performance Graph displays the results associated with the Key Metric you select in the Report Options (e.g., clicks, impressions, CTR, or spend) for the date range you have selected.
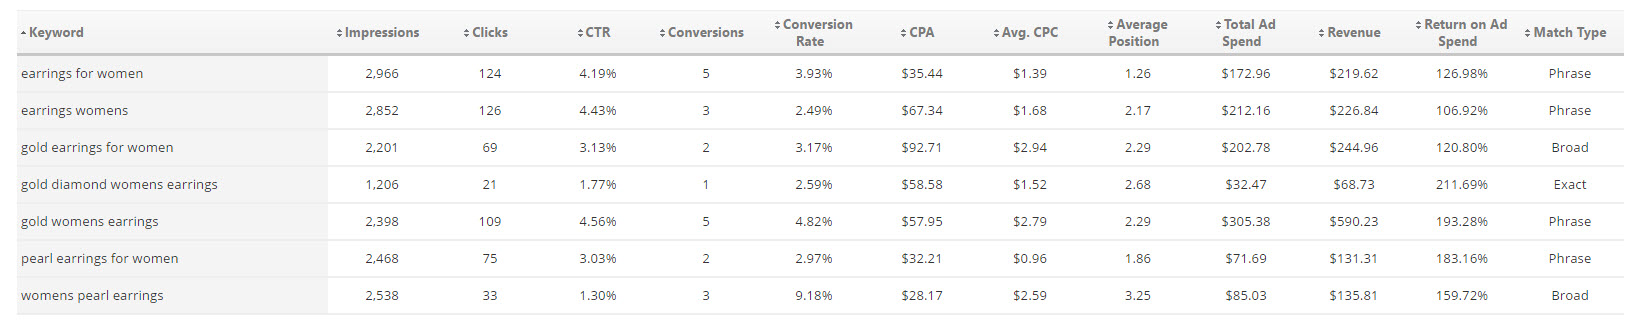
The Ads Keyword metrics table displays the following metrics for each keyword: ad impressions, ad clicks, CTR (click through rate), conversions, conversion rate, CPA (cost per action), average CPC (cost per click), average ad position, total ad spend, revenue, return on ad spend and the keyword match type (Exact, Phrase or Broad).
The table can be sorted by any of the columns by clicking on the header of the column you want to sort by either in ascending or descending order.
Bing Ads Reports & Graphs
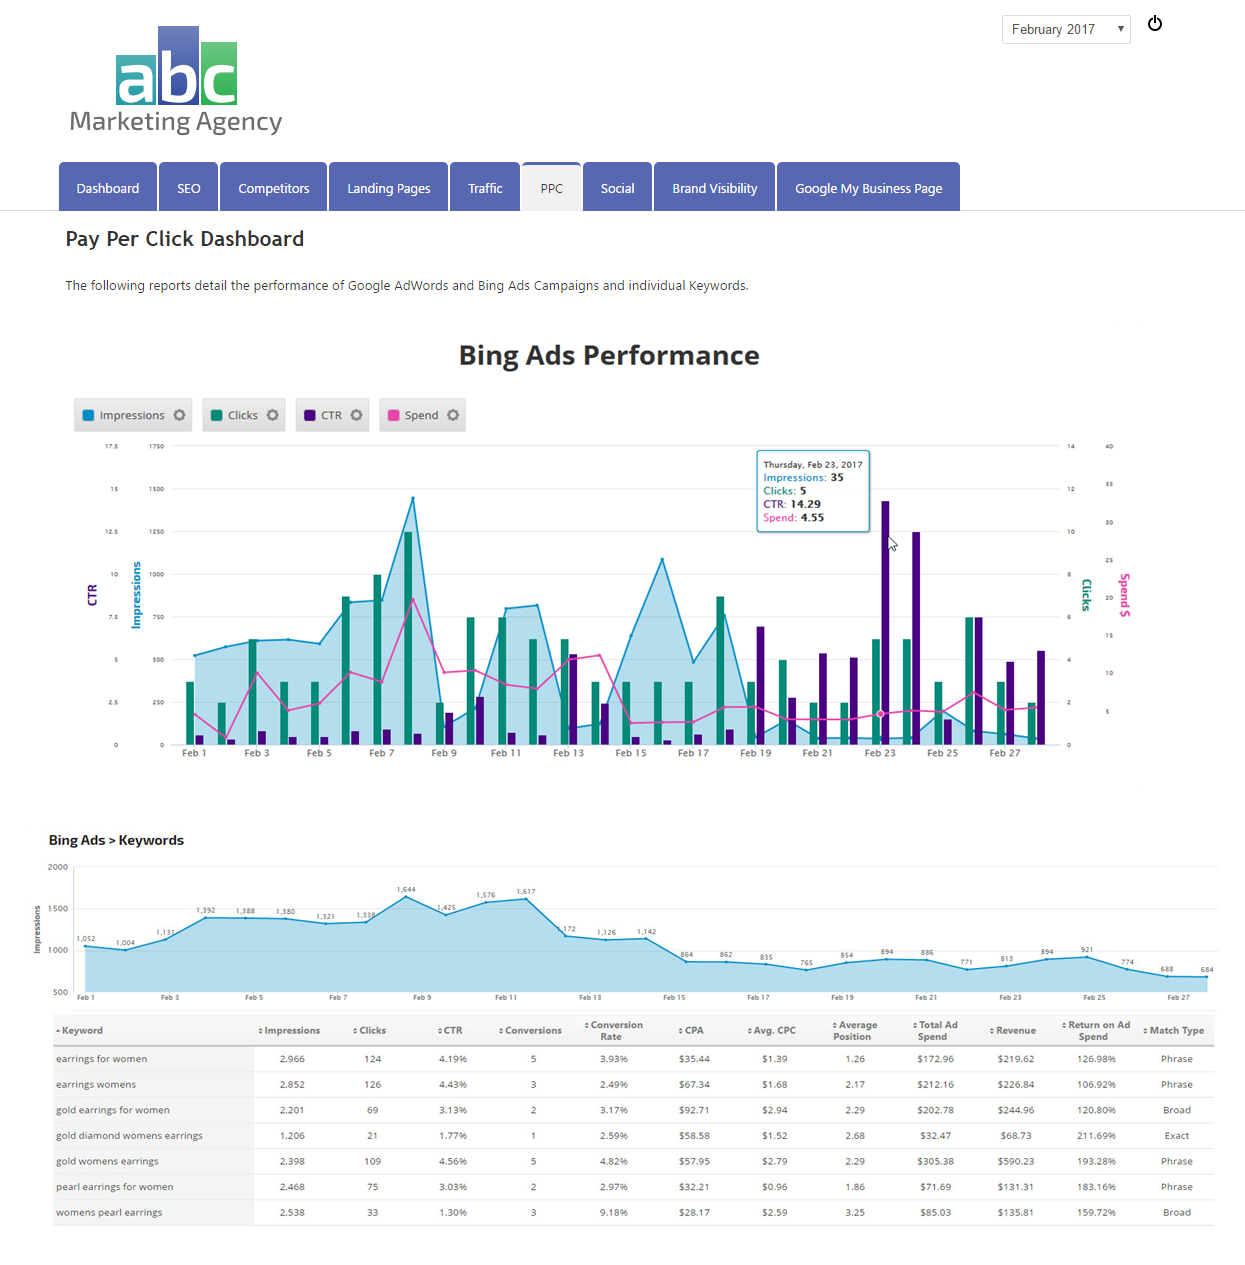
A white label marketing dashboard can be used to highlight Bing Ads performance. In this example, a text box is used to introduce the report that includes an interactive Insight Graph of Bing Ads PPC performance, followed by the Bing Ads Keywords report trending impressions in the performance graph, and a table displaying all available metrics (you may choose to highlight specific metrics and hide others).
A white label marketing dashboard can be used to highlight Bing Ads performance. In this example, a text box is used to introduce the report that includes an interactive Insight Graph of Bing Ads PPC performance, followed by the Bing Ads Keywords report trending impressions in the performance graph, and a table displaying all available metrics (you may choose to highlight specific metrics and hide others).
 |
Date:
|
 |
General Settings:
|
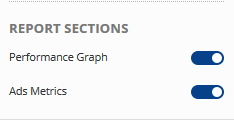 |
Show or Hide Report Sections:
|
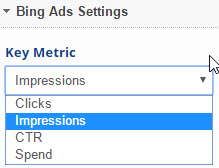 |
Select the Bing Ads Key Metric:The Key Metric determines the type of data displayed in the Performance Graph
|
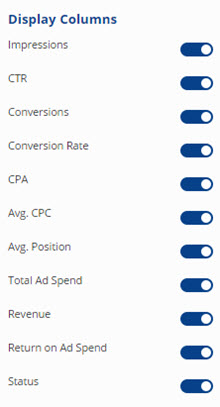 |
Display Columns:
|
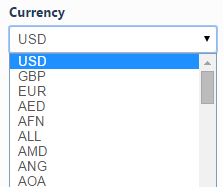 |
Currency:
|
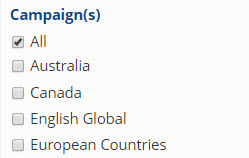 |
Filter by Bing Campaign(s):
|
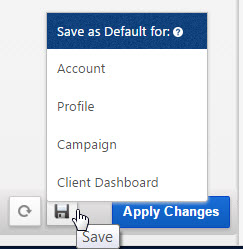 |
Save
|
Bing Ads Custom Graphs & Widgets
Bing Ads performance data can be displayed in Insight Graphs and Metric Widgets and shared in white label Marketing Dashboards, Client Dashboards, and scheduled PDF Reports.
If you aren't familiar with building custom graphs, please refer to the following documentation to learn more about the variety of customization options.
Graph Settings
In both the Insight Graph and Metric Widgets:
Repeat for each individual metric that you want included on the graph.
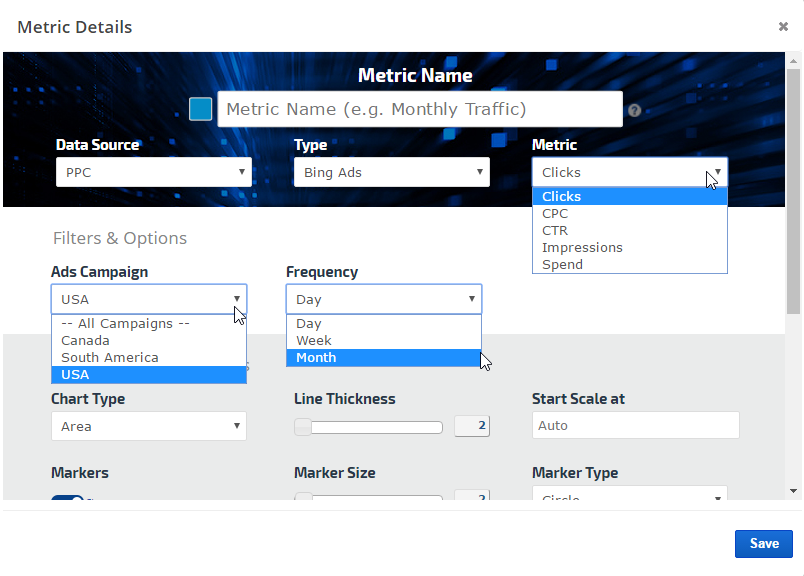
In both the Insight Graph and Metric Widgets:
- Enter a Metric Name for display in the graph
- Data Source: PPC
- Type: Bing Ads
- Metric: Clicks, CPC, CTR, Impressions, or Spend
Repeat for each individual metric that you want included on the graph.
If you aren't familiar with building custom graphs, please refer to the following documentation to learn more about the variety of customization options.
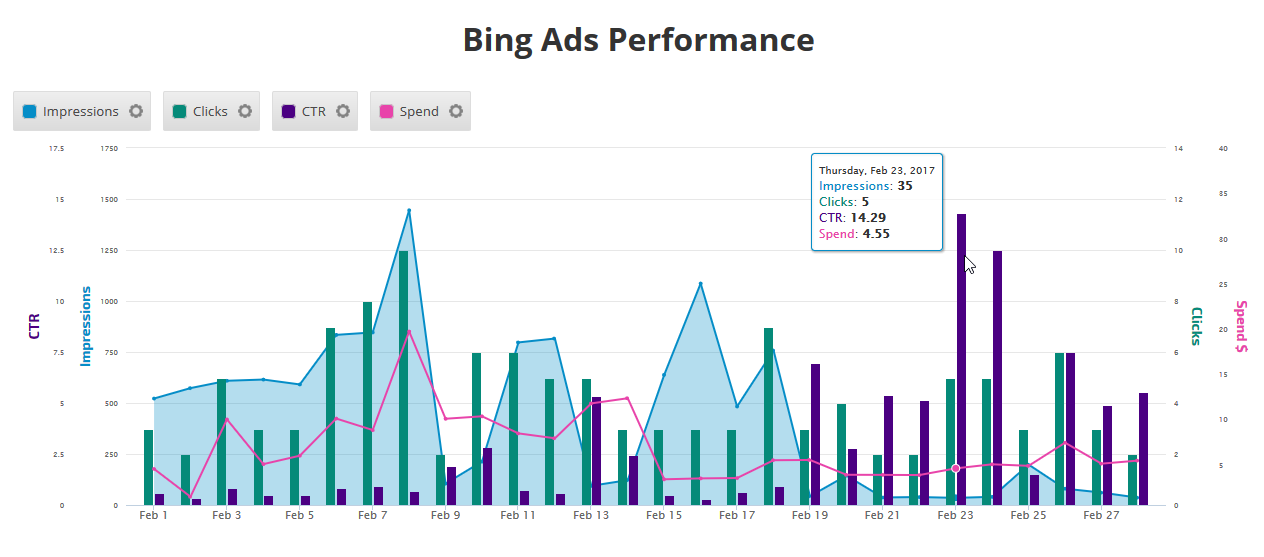
Bing Ads Insight Graph
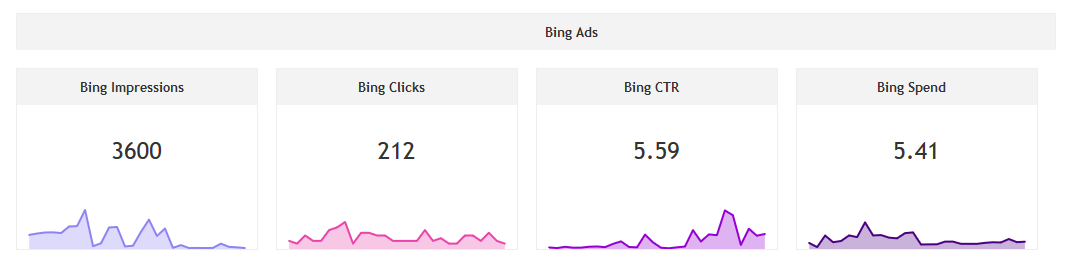
Bing Ads Metric Widgets
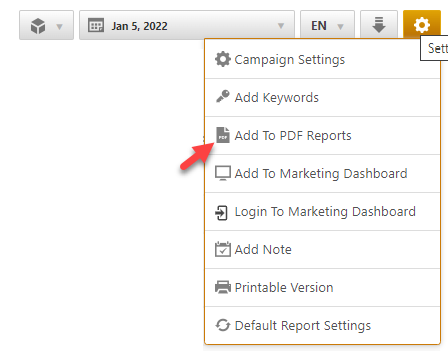
Add to PDF Report
Conveniently add a report or graph with its current settings to a PDF report by hovering over the gold gear icon and selecting Add to PDF Reports
Select the PDF Report that you want the report or graph added to
Drag the new report or graph into the position you want it to display in the PDF and confirm that the Date settings do not conflict with the automated scheduling settings.
Add to Marketing Dashboard
Conveniently add a report or graph with its current settings to a marketing dashboard:
1. Hover over the gold gear icon and select Add to Marketing Dashboard
2. Select the Dashboard (campaign name)
3. Select the Dashboard Page that you want the report added to

1. Hover over the gold gear icon and select Add to Marketing Dashboard
2. Select the Dashboard (campaign name)
3. Select the Dashboard Page that you want the report added to
4. Click the "Go to Dashboard" link to further customize the report (e.g., drag it to a specific position on the page, change date settings, etc.)

Refer to the Report Options section for details regarding the display settings, filters and sort options available for this report.
The report date (or date range) is governed by the selected Dashboard date option: Date Selection or Fixed Periods, learn more...
- Daily reports default to the last day of the selected period
- Weekly and monthly reports default to 1 month of data