Search our Knowledge Base
Search

CallRail Calls Detail Report


The CallRail Call Details report includes inbound and outbound call statistics, including an overview with the total number of calls, number of first time callers, answered calls, missed calls and average talk time. A customizable table includes call performance metrics per individual call detailing:
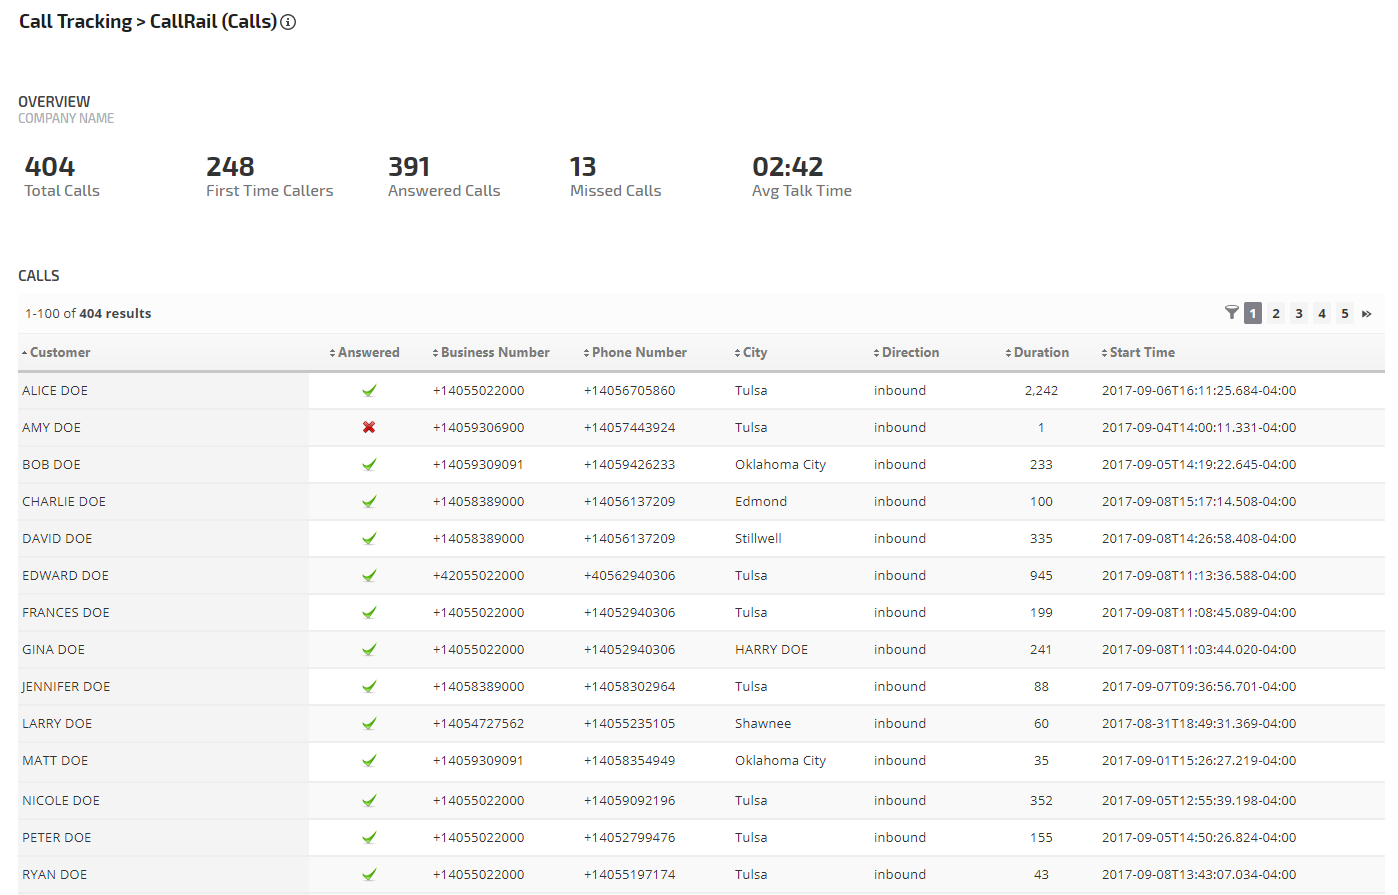
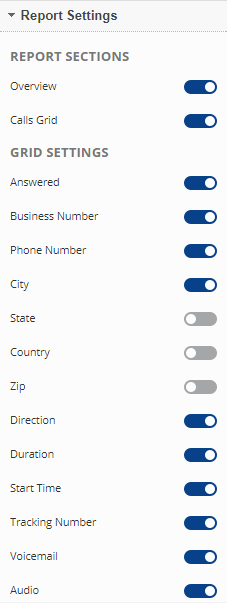
  • Whether or not the call was Answered
  • Business Number
  • Phone Number
  • City
  • State
  • Country
  • Zip
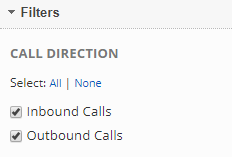
  • Direction (inbound or outbound)
  • Duration
  • Start Time
  • Tracking number
  • Whether or not Voicemail was left
  • Audio recording per call (if available in the account)

CallRail provides call tracking and measures call conversions from search, offline and digital marketing campaigns, including PPC keywords - refer to our CallRail Overview report to view these metrics.

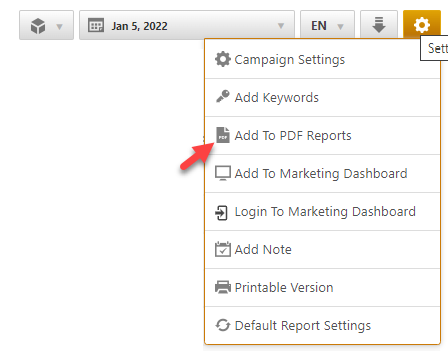
CallRail reports are located in Reports & Tools > Digital Marketing > Call Tracking.

Important! To view this report, you must authorize a connection to a CallRail account.
Call Tracking Metrics report


CallRail Call Details

 
Example

Callrail Metrics call detail report


Report Options

 
select a report date

Report Dates

  • Select a Report Date range from the Report Options calendar tool or select a Custom Date Range in the top right toolbar
Report Title

General Options

  • Enter a custom report title, if desired.
Show or Hide Report Sections

Show or Hide Report Sections

  • Overview header with company name and totals
  • Calls grid is the table of individual call details
Grid Settings
Show or hide the following table columns:
  • Answered
  • Business Number
  • Phone Number
  • City
  • State
  • Country
  • Zip
  • Direction (inbound or outbound call)
  • Duration
  • Start Time
  • Tracking Number
  • Voicemail
  • Audio (if available in the CallRail account, you can click to listen to the call recording)

report filters

Call Direction Filters

  • Inbound Calls
  • Outbound Calls


Add to PDF Report


Conveniently add a report or graph with its current settings to a PDF report by hovering over the gold gear icon and selecting Add to PDF Reports

add report to PDF


Select the PDF Report that you want the report or graph added to
             
select white label report

Drag the new report or graph into the position you want it to display in the PDF and confirm that the Date settings do not conflict with the automated scheduling settings.

Add to Marketing Dashboard


Conveniently add a report or graph with its current settings to a marketing dashboard:

1. Hover over the gold gear icon and select Add to Marketing Dashboard
2. Select the Dashboard (campaign name)
3. Select the Dashboard Page that you want the report added to


add report to PDF


4. Click the "Go to Dashboard" link to further customize the report (e.g., drag it to a specific position on the page, change date settings, etc.)


Refer to the Report Options section for details regarding the display settings, filters and sort options available for this report.

The report date (or date range) is governed by the selected Dashboard date option: Date Selection or Fixed Periods, learn more...

  • Daily reports default to the last day of the selected period
  • Weekly and monthly reports default to 1 month of data
To change the number of weeks or months displayed in a specific report, click the gear icon for any marketing dashboard report element and expand the Date option section, enter the number and click the Save Button.
 
marketing dashboard report date options


Get the ultimate SEO tools with the Rank Ranger Software
Learn More About Rank Ranger