The Campaigns Overview is an Enterprise report updated weekly on Mondays for a wide range of metrics in the categories of Rank, Google Analytics, Google Search Console, and Social Analytics, across all campaigns in an account. The User Breakdown widget option is available to display a graph with a combined average rank per selected user. The table will include all campaigns related to the selected user with data per campaign.
This report is intended mainly for your internal use, however, it may be added to a Marketing Dashboard to share with your clients.
- SEO
- Rank Tracker
- Local SEO
- Mobile SEO
- Link Manager
- Landing Pages
- Social Signals
- On-Page Optimization
- Enterprise SEO Solutions
- Marketing
- Competition Analysis
- Insight Graph
- Keyword Research
- Graphs & Widgets
- Market Reach
- Marketing KPI
- Brand Visibility
- White Label SEO
- Marketing Dashboard
- Client Dashboard
- PDF Reports
- PDF Templates
- Other
- Email Notifications
- Portfolio Management
- Integrations
- Google Analytics
- Search Console
- Pay Per Click
- WeDevelop
- API
Campaigns Overview
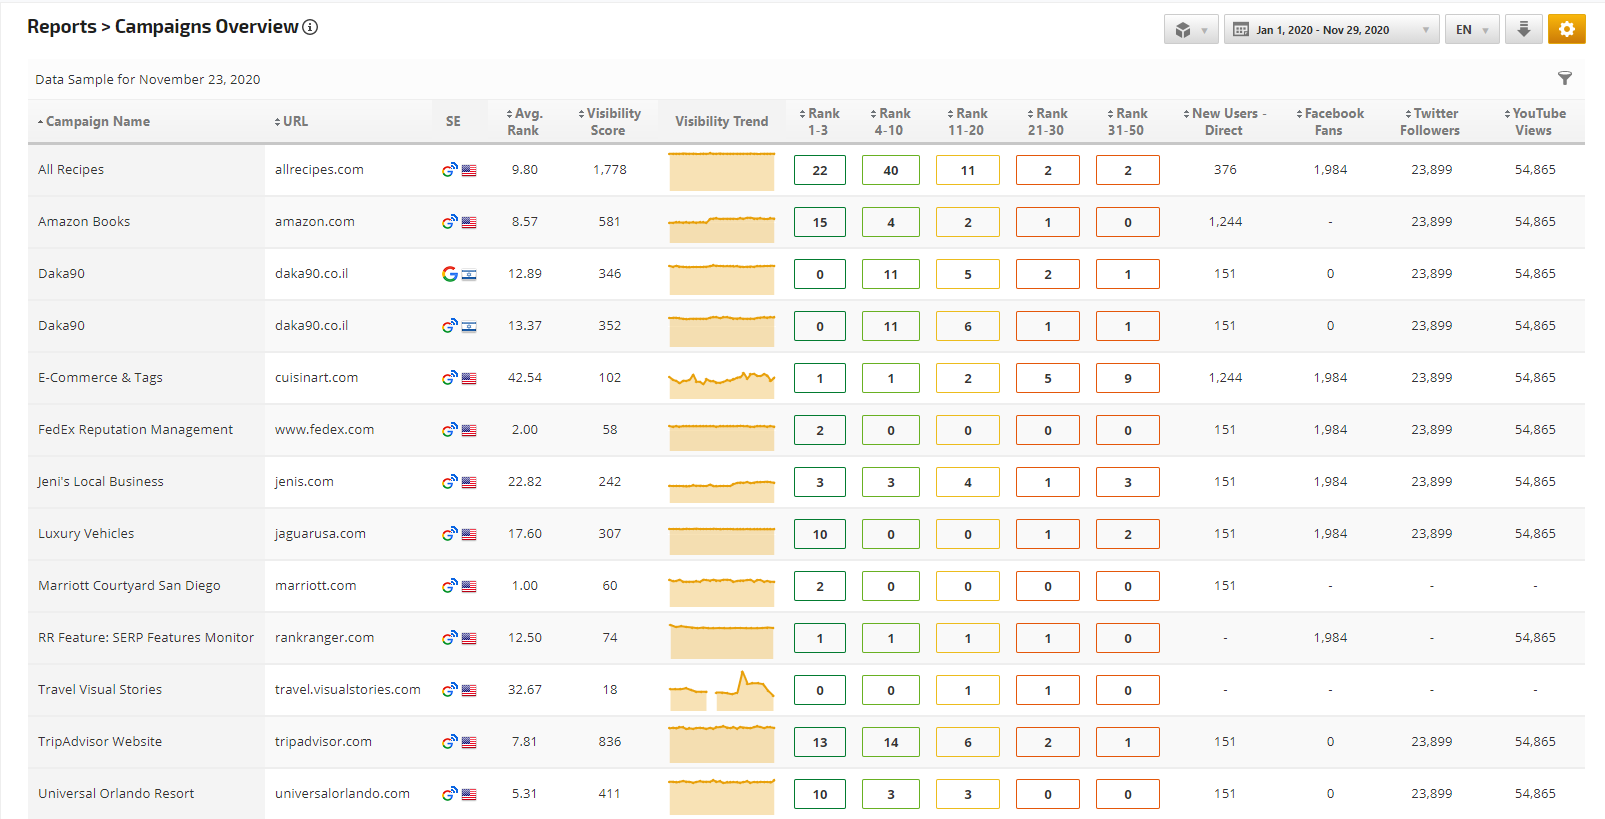
Example of Average Rank, Visibility Score & Trend, Rank Position Stats, Traffic, and Social
In addition, the Average Rank Change, Visibility Score Change, and Rank Distribution Change (for each distribution) are available compared to either Last Week/Last Month, depending on the option selected.
In addition, the Average Rank Change, Visibility Score Change, and Rank Distribution Change (for each distribution) are available compared to either Last Week/Last Month, depending on the option selected.
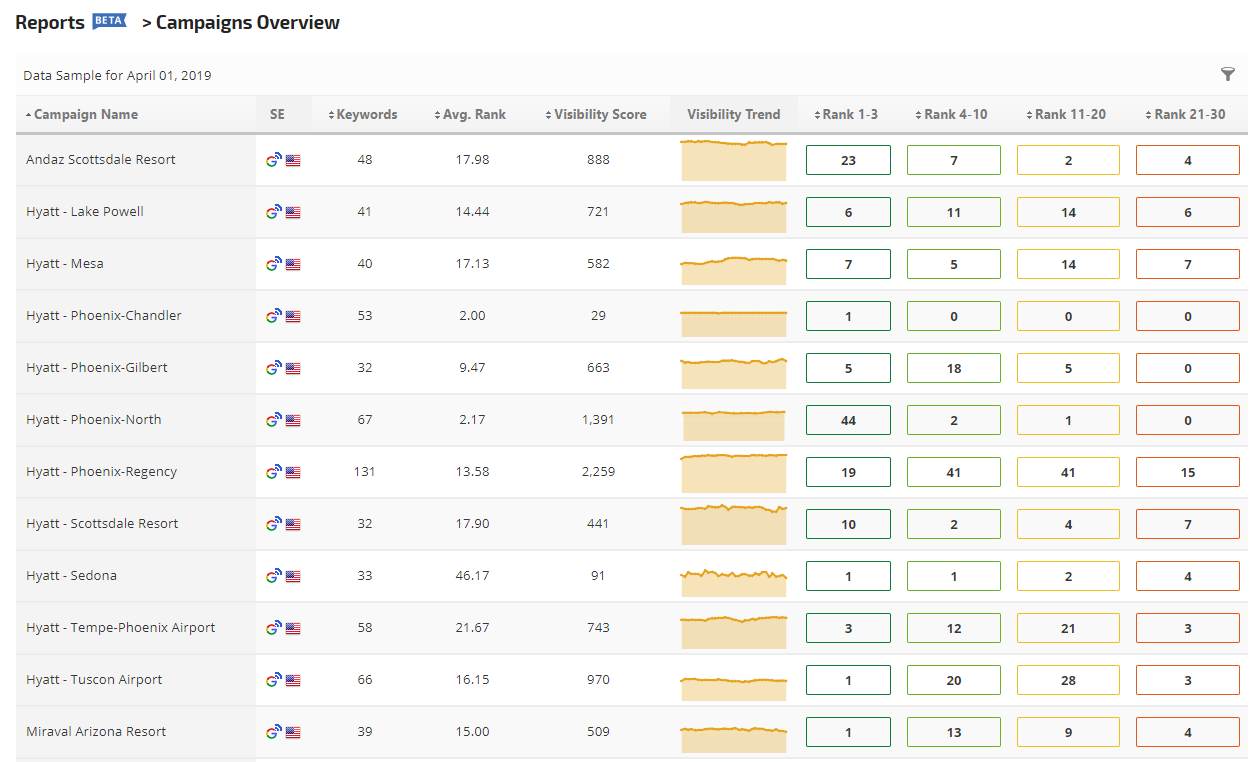
Example of Mobile Tracking of Average Rank, Visibility & Rank Positions
In this example, we're displaying the campaign name, search engine, number of keywords, and the following metrics:
In this example, we're displaying the campaign name, search engine, number of keywords, and the following metrics:
- Average Rank: the average rank of all campaign keywords for 1 day based on the last Monday of the report date range (e.g., if the date range is April 1 - April 30, 2019, then the data will be based on Monday, April 29th).
- Visibility Score: the visibility score for all campaign keywords and selected search engines for 1 day based on the last Monday of the report date range.
- Visibility Trend: a graph of daily visibility scores for a 30-day period ending on the Monday that the data was last updated (i.e., the Monday prior to the last day of the report date range).
- Rank Position Stats: the number of times that campaign keywords ranked in the selected position ranges for all the selected search engines, during the 30 day period ending on the last Monday of the report date range. For example, if 10 keywords ranked in positions 1 through 3 for 30 days on 2 search engines, then that equals 600 rankings in positions 1-3 (10 x 30 x 2).
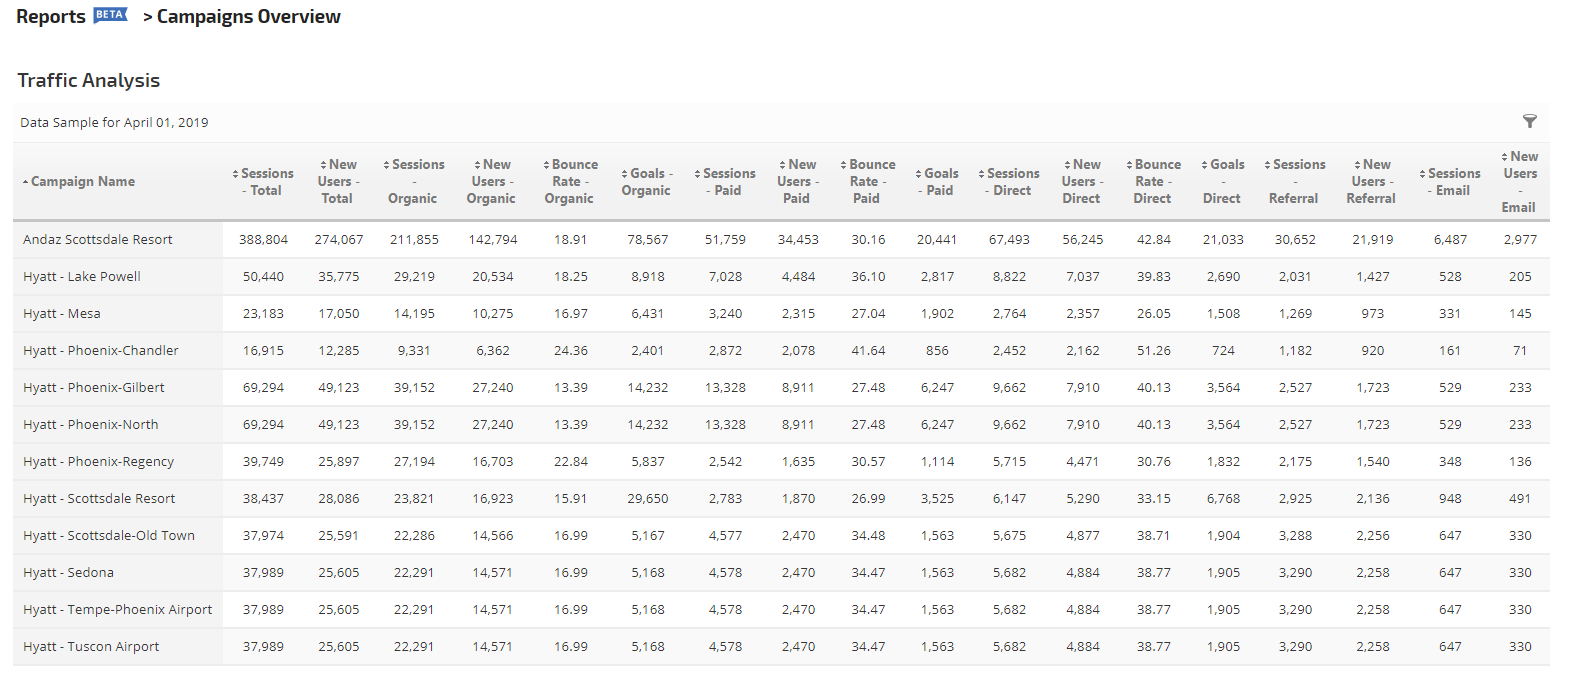
Example of Traffic Analysis: Totals, Organic, Paid, Direct, Referral & Email
All Traffic metrics require that campaigns be integrated with each domain's Google Analytics profile. Google Analytics data in this report is based on the 30-day period leading up to the Monday that the report was updated. Please refer to the Google Search & Ad Metrics Glossary section below for more information regarding the metrics available in this report.
Important! Google sometimes provides sampled data via their API integration depending upon your Google account usage, please refer to their support document on this topic.
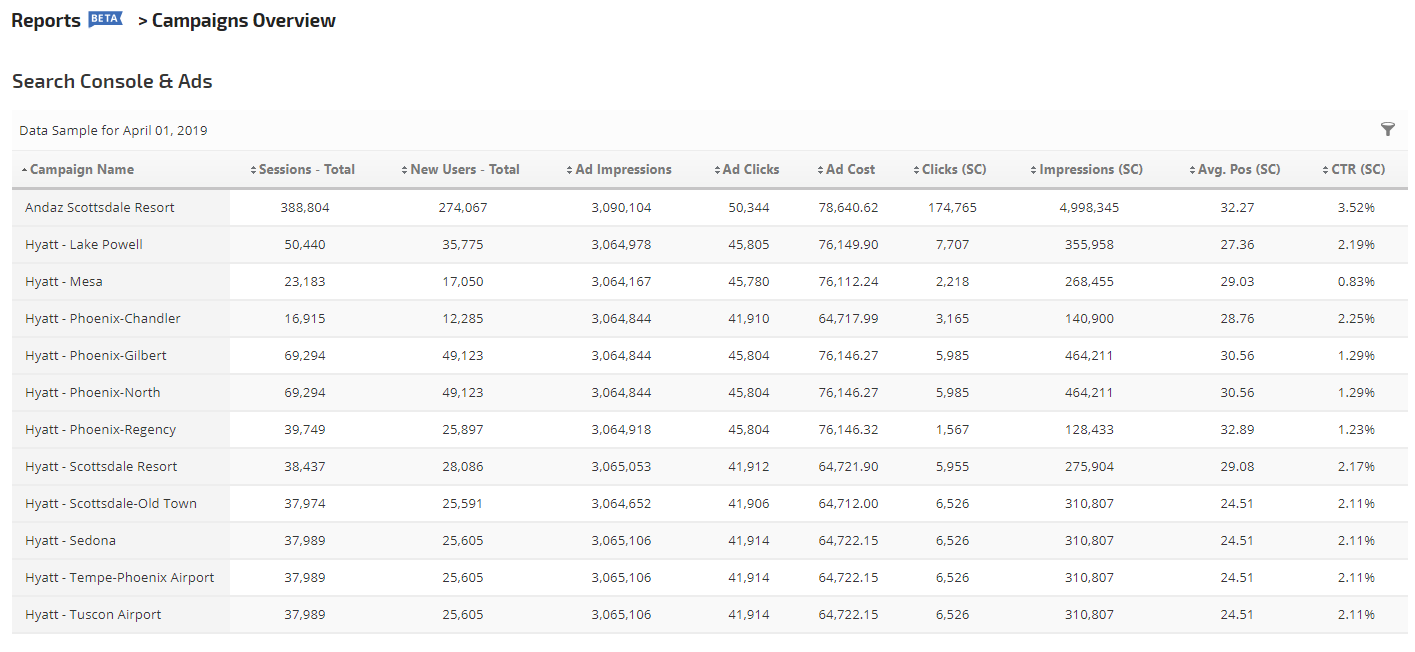
Example of Metrics from Google Search Console & Ads
Impressions, clicks, CTR, and Average position are based on Search Console API data availability. Google usually makes this data available 3 to 4 days after they collect it (i.e., if you select a report end date of March 31st, it can be April 4th before the data is available via the API). Search Console integration is required for each campaign in order to display data for these metrics.
For Ad data, Google Analytics must be configured correctly (please refer to our Google Analytics documentation) for the primary domain. In addition, Google Ads must be linked to your Google Analytics profile (refer to Link Google Analytics and Ads).
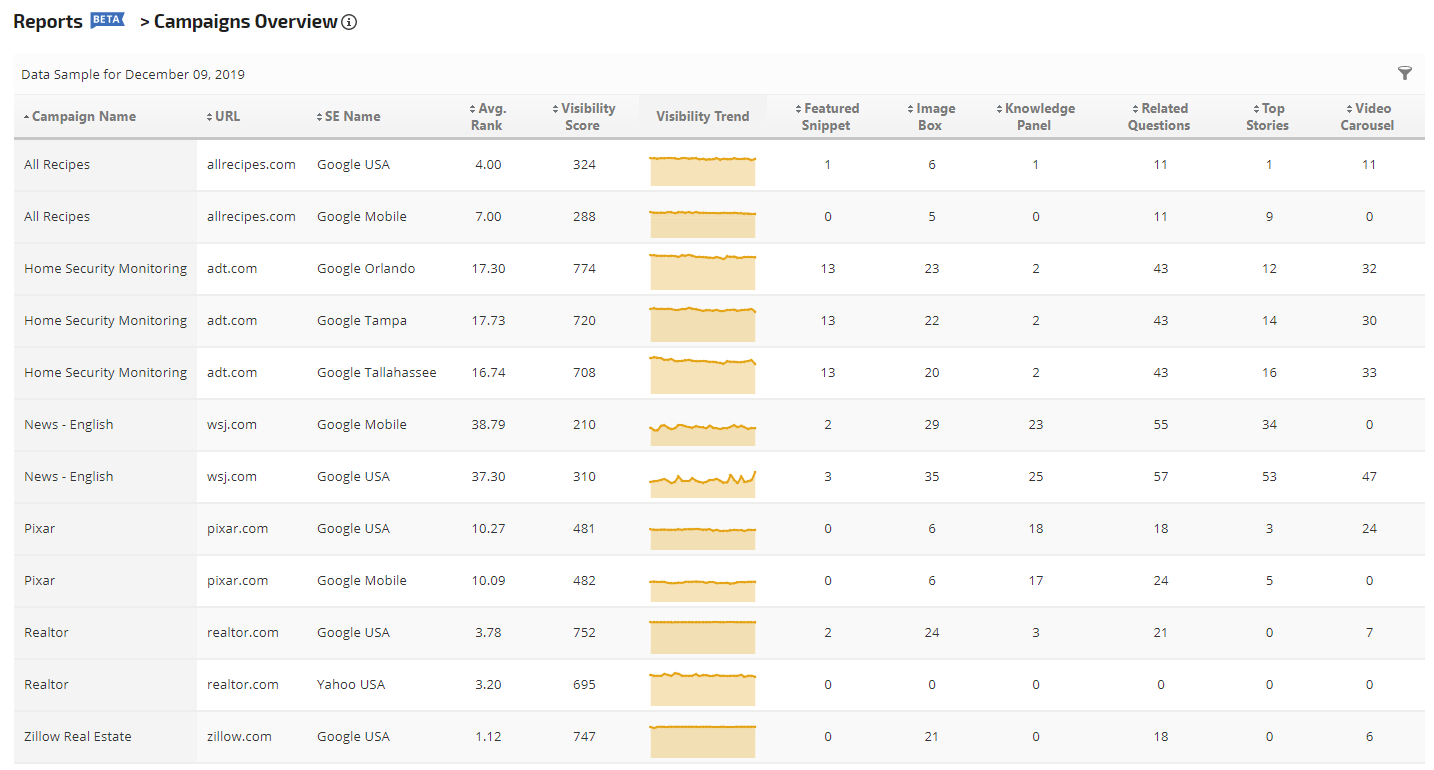
Example of SERP Features Appearances, Average Rank and Visibility Score and Trends
In addition to enabling the display of average rank, visibility score, and visibility trend in Report Options, you may choose to add any of the following SERP Feature appearance metrics to your report:
In addition to enabling the display of average rank, visibility score, and visibility trend in Report Options, you may choose to add any of the following SERP Feature appearance metrics to your report:
- Featured Snippet
- Hotel Pack
- Image Box
- Google for Jobs Box
- Knowledge Panel
- Local Pack
- Related Questions
- Top Stories
- Video Carousel
User Breakdown Graph
The Campaigns Overview report has the ability to report an average rank grouped by user. To display the User breakdown graph
Only the campaigns assigned to the selected user will be displayed in the table below the graph. The points on the lines in the graph represent the weekly average rank for combined campaigns related to the selected user. One graph line per user.

The Campaigns Overview report has the ability to report an average rank grouped by user. To display the User breakdown graph
- Go to Report Options > Widgets and turn on a toggle Enable Widgets
- Then turn on a toggle for Users.
- Select the users from the list in Report Options > Users
- Click Apply Change.
Only the campaigns assigned to the selected user will be displayed in the table below the graph. The points on the lines in the graph represent the weekly average rank for combined campaigns related to the selected user. One graph line per user.
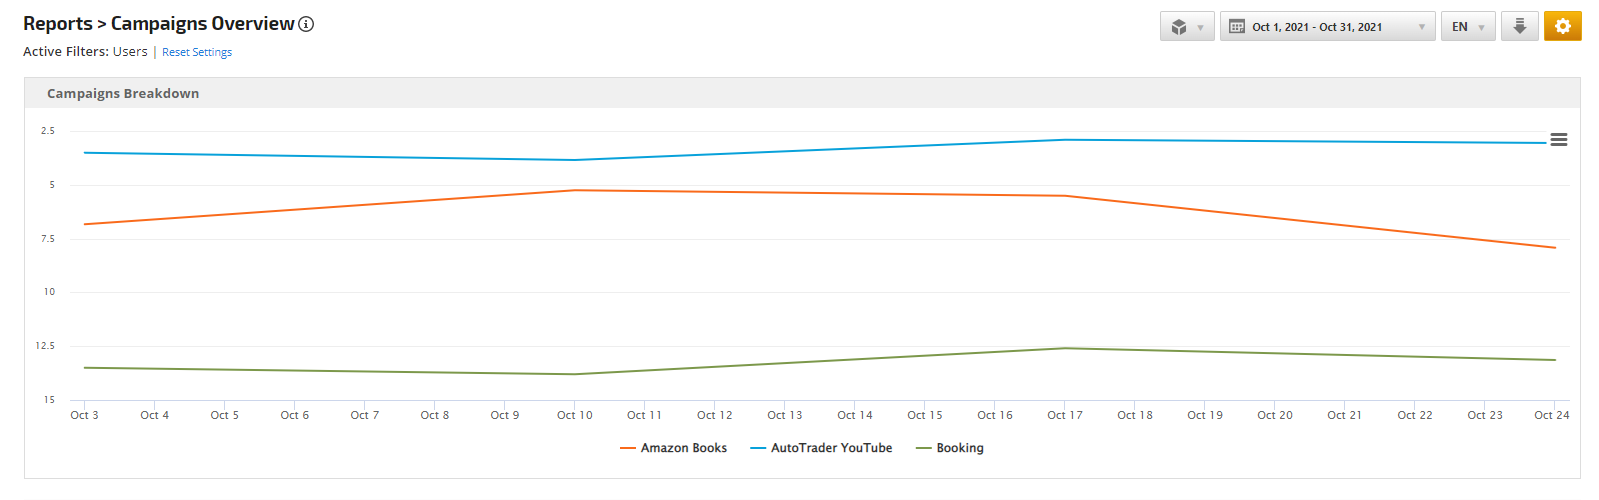
Campaign Breakdown Graph
The Campaigns Overview report has the ability to report an average rank grouped by campaigns.
A line per campaign will be displayed. The points on the lines in the graph represent the weekly average rank for each campaign selected from the Report Options > Campaigns list.
The Campaigns Overview report has the ability to report an average rank grouped by campaigns.
- Go to Report Options > Widgets and turn on a toggle Enable Widgets
- Then turn on a toggle for Campaigns.
- Select the users from the list in Report Options > Campaigns
- Click Apply Change.
A line per campaign will be displayed. The points on the lines in the graph represent the weekly average rank for each campaign selected from the Report Options > Campaigns list.
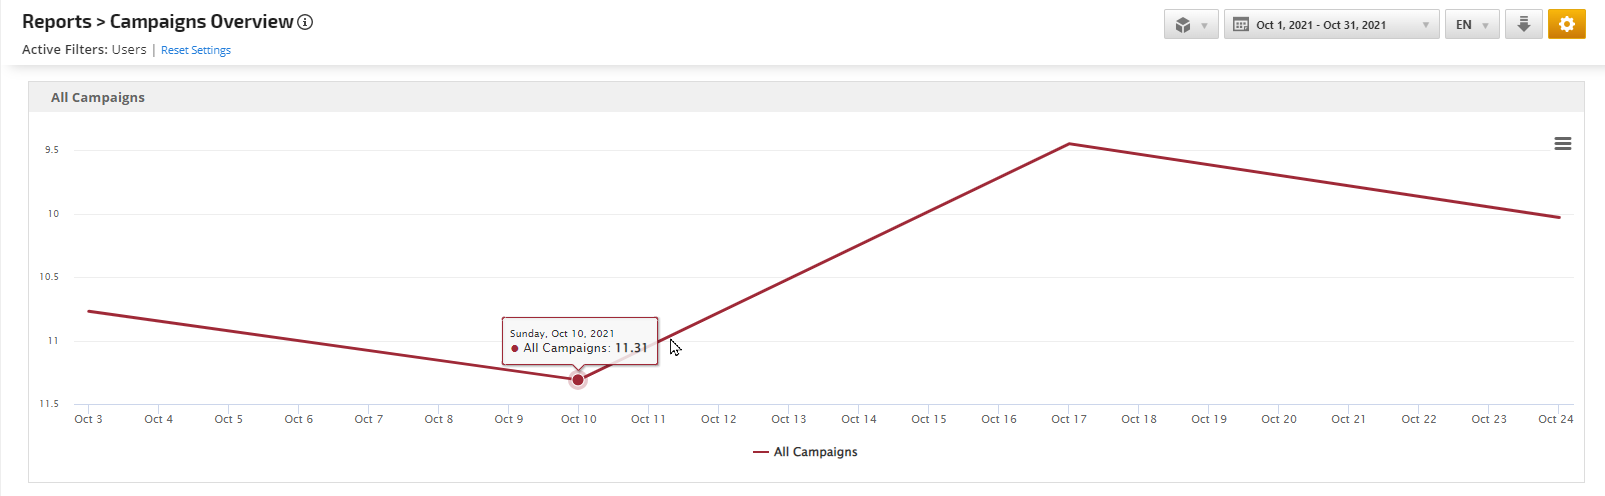
Accountwide Graph
The Campaigns Overview report has the ability to report an average rank for an entire account including all campaigns.
The Campaigns Overview report has the ability to report an average rank for an entire account including all campaigns.
- Go to Report Options > Widgets and turn on a toggle Enable Widgets
- Then turn on a toggle for Accountwide.
- Click Apply Change.
 |
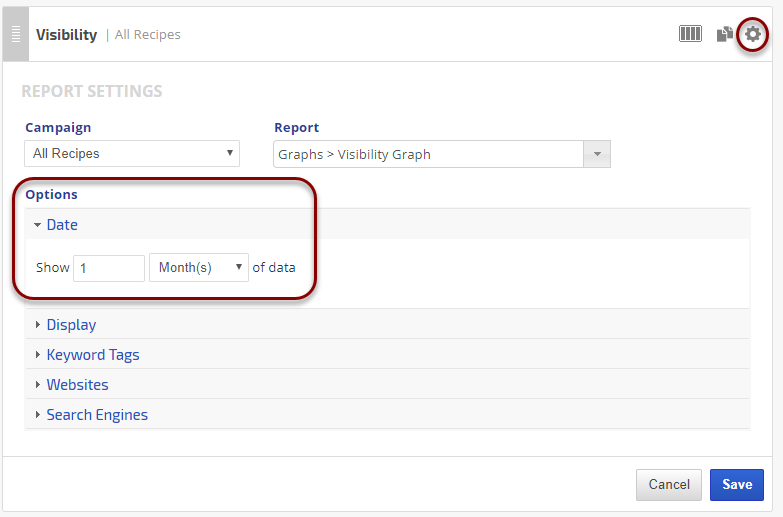
Date
|
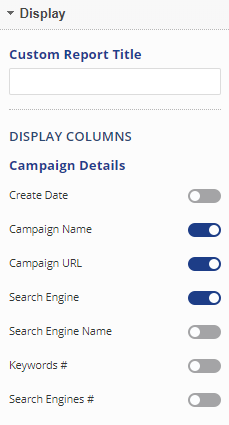 |
Display
Campaign DetailsDisplay or hide the following report columns:
|
Rank Metrics
|
|
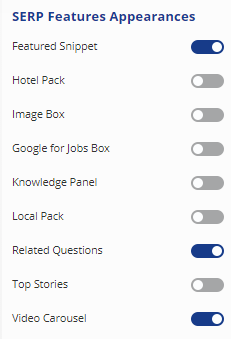 |
SERP Features AppearancesDisplay or hide the following SERP Features Appearances columns to view the total number of times they appeared in search results:
|
 |
Google Analytics Traffic - TotalAll Traffic metrics require that campaigns be integrated with each domain's Google Analytics profile. Google Analytics data in this report is based on the 30-day period leading up to the Monday that the report was updated. Please refer to the Google Search & Ad Metrics Glossary section below for more information regarding the metrics available in this report. Important! Google sometimes provides sampled data via their API integration depending upon your Google account usage, please refer to their support document on this topic. Display or hide the following total traffic report columns:
|
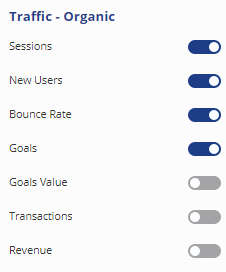 |
Traffic - OrganicDisplay or hide the following organic traffic report columns:
|
 |
Traffic - PaidDisplay or hide the following paid traffic report columns:
|
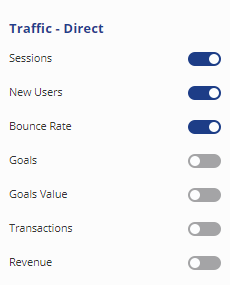 |
Traffic - DirectShow or hide the following direct traffic report columns:
|
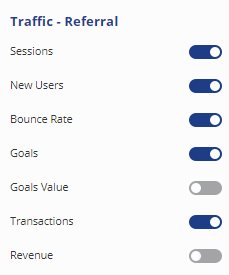 |
Traffic - ReferralDisplay or hide the following referral traffic report columns:
|
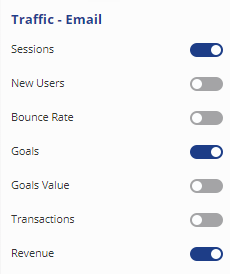 |
Traffic - EmailDisplay or hide the following email traffic report columns:
|
 |
AdsFor Ad data, Google Analytics must be configured correctly (please refer to our Google Analytics documentation) for the primary domain. In addition, Google Ads must be linked to your Google Analytics profile (refer to Link Google Analytics and Ads). Display or hide the following Google Ads report columns:
|
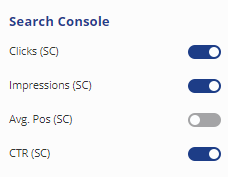 |
Search ConsoleThis section of the report is based on Search Console API data availability. Google usually makes this data available 3 to 4 days after they collect it (i.e., if you select a report end date of March 31st, it can be April 4th before the data is available via the API). Search Console integration is required for each campaign in order to display data for these metrics. |
 |
SocialIntegration with Facebook, Twitter, YouTube, Instagram, and/or LinkedIn analytics is required in order for social data to be available in this report. Display or hide the following social analytics report columns:
|
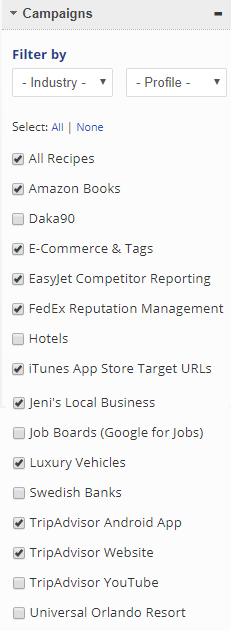 |
CampaignsSelect the campaigns that you want to be included in this report using one of these methods:
|
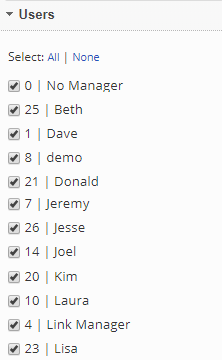 |
Users
|
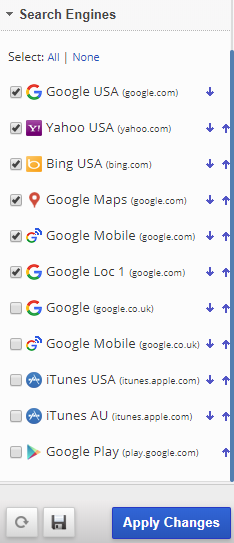 |
Search Engines
|
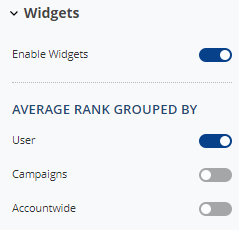 |
Widgets
|
Add to PDF Report
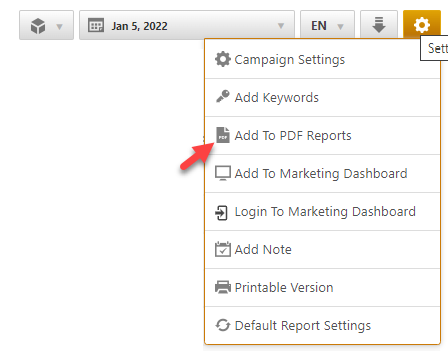
Conveniently add a report or graph with its current settings to a PDF report by hovering over the gold gear icon and selecting Add to PDF Reports
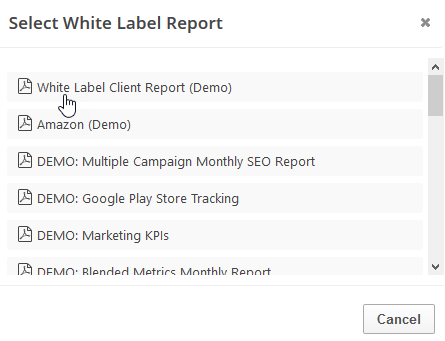
Select the PDF Report that you want the report or graph added to
Drag the new report or graph into the position you want it to display in the PDF and confirm that the Date settings do not conflict with the automated scheduling settings.
Add to Marketing Dashboard
Conveniently add a report or graph with its current settings to a marketing dashboard:
1. Hover over the gold gear icon and select Add to Marketing Dashboard
2. Select the Dashboard (campaign name)
3. Select the Dashboard Page that you want the report added to

1. Hover over the gold gear icon and select Add to Marketing Dashboard
2. Select the Dashboard (campaign name)
3. Select the Dashboard Page that you want the report added to
4. Click the "Go to Dashboard" link to further customize the report (e.g., drag it to a specific position on the page, change date settings, etc.)

Refer to the Report Options section for details regarding the display settings, filters and sort options available for this report.
The report date (or date range) is governed by the selected Dashboard date option: Date Selection or Fixed Periods, learn more...
- Daily reports default to the last day of the selected period
- Weekly and monthly reports default to 1 month of data