The Google My Business Overview report provides a dashboard full of GMB metrics with historical data of 18 months that can help a business determine how and when customers find and interact with their business listings on Google.
Integrate your Google My Business account with Rank Ranger to view and share this report in white label dashboards and PDF reports.
- SEO
- Rank Tracker
- Local SEO
- Mobile SEO
- Link Manager
- Landing Pages
- Social Signals
- On-Page Optimization
- Enterprise SEO Solutions
- Marketing
- Competition Analysis
- Insight Graph
- Keyword Research
- Graphs & Widgets
- Market Reach
- Marketing KPI
- Brand Visibility
- White Label SEO
- Marketing Dashboard
- Client Dashboard
- PDF Reports
- PDF Templates
- Other
- Email Notifications
- Portfolio Management
- Integrations
- Google Analytics
- Search Console
- Pay Per Click
- WeDevelop
- API
Google My Business Overview
Located in Reports > Organic Search > Google My Business
Chart & Graph Features
Hover over a chart section to reveal the number associated with each metric.
Hover over a chart section to reveal the number associated with each metric.
Click a metric label below the graph to turn its display on and off.
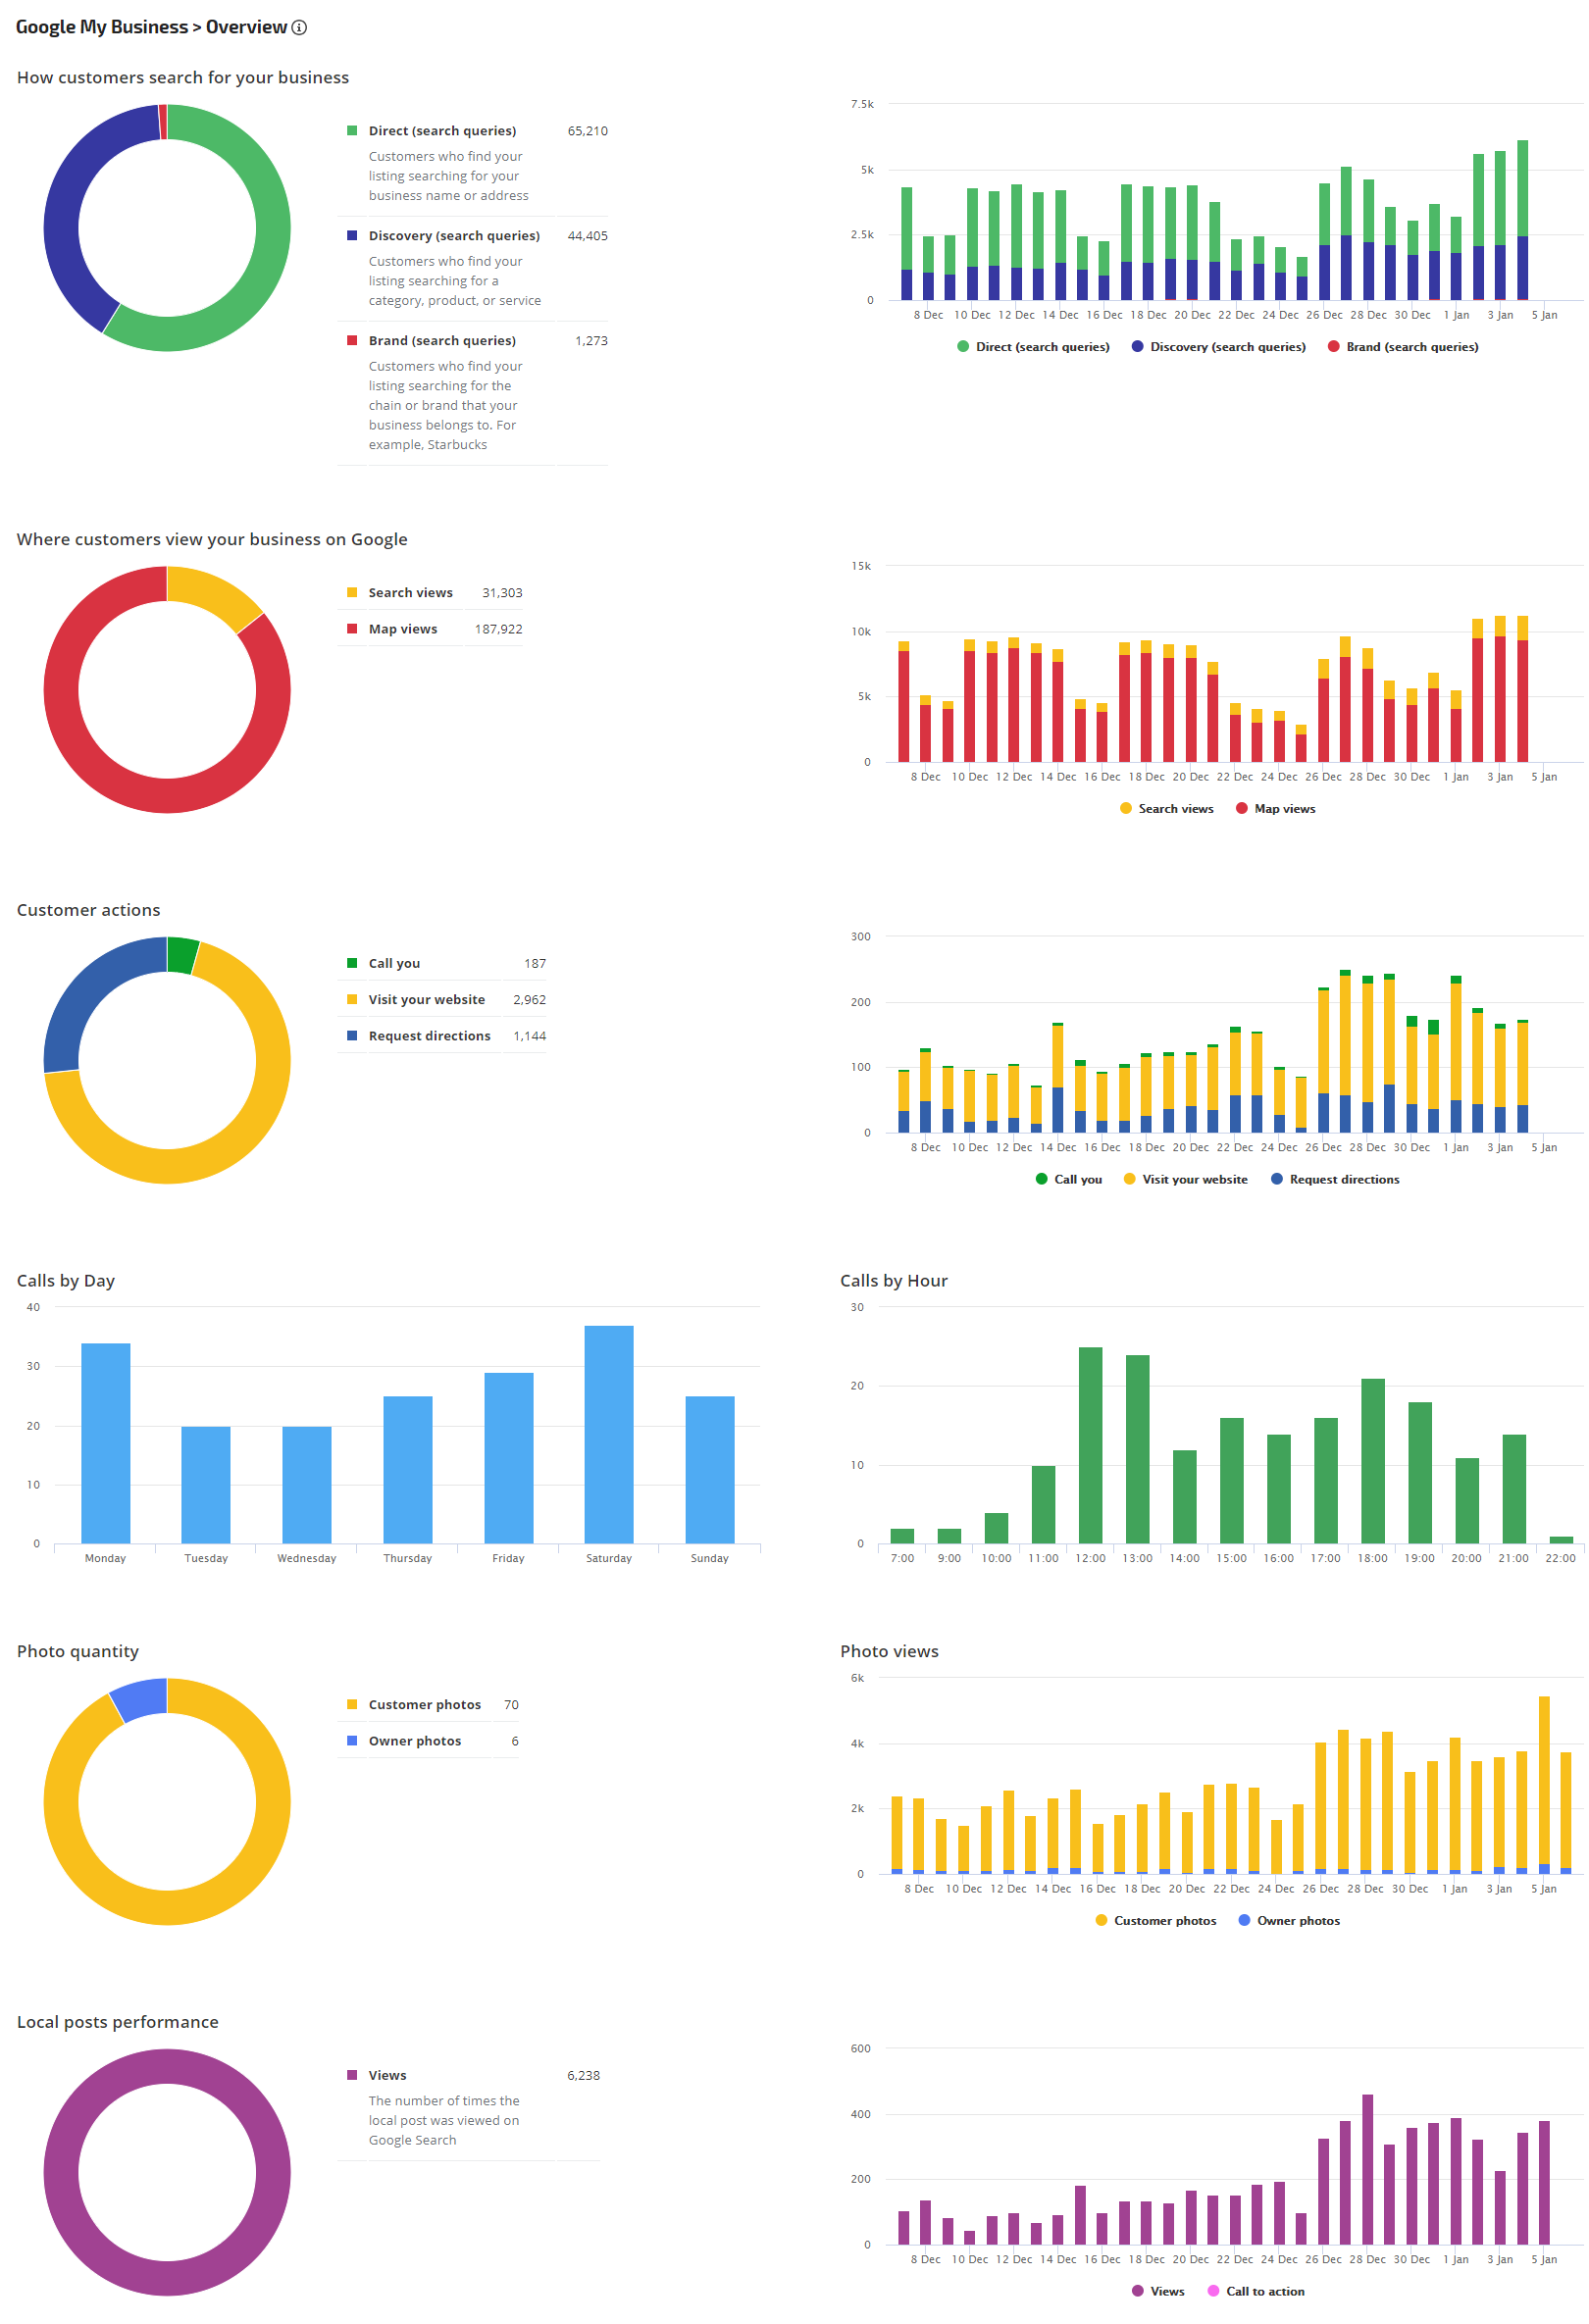
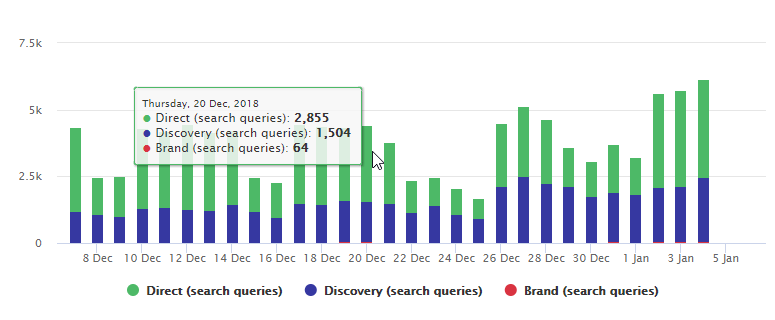
Direct Search Queries vs. Discovery Search Queries
People who find a Google business listing by searching on the business name or address are considered to be Direct search queries, whereas people who find the business listing by searching for a category, product, or service are classified as Discovery search queries, and searches for a franchise or chain name are classified as Brand search queries.

People who find a Google business listing by searching on the business name or address are considered to be Direct search queries, whereas people who find the business listing by searching for a category, product, or service are classified as Discovery search queries, and searches for a franchise or chain name are classified as Brand search queries.
Direct vs. Discovery Graph
This graph provides a daily breakdown of how customers search for the business listing.
This graph provides a daily breakdown of how customers search for the business listing.
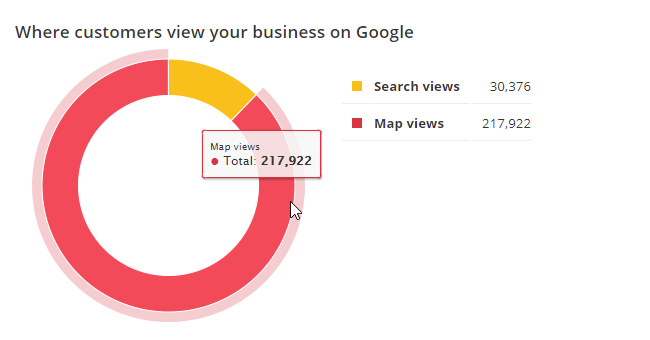
Google Business Search Views and Map Views
This chart details the number of times the business listing was viewed on Google Search vs. on Google Maps
This chart details the number of times the business listing was viewed on Google Search vs. on Google Maps
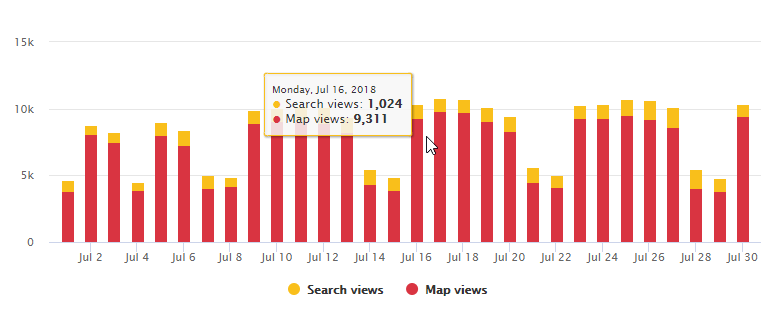
Search Views vs. Map Views Graph
This graph provides the number of search views vs. map views for each day during the selected reporting period.
This graph provides the number of search views vs. map views for each day during the selected reporting period.
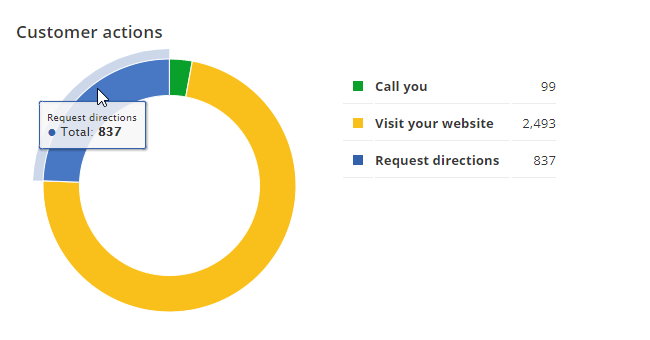
Calls, Directions, and Website Visits
Hover over a chart section to review the number of customer actions: calls to the business, website visits, and requests for directions to the business location.
Hover over a chart section to review the number of customer actions: calls to the business, website visits, and requests for directions to the business location.
Customer Actions Graph
Hover over a bar for a specific date to view the number of requests for directions to the business, phone calls, and clicks through to the website associated with the Google My Business listing.

Hover over a bar for a specific date to view the number of requests for directions to the business, phone calls, and clicks through to the website associated with the Google My Business listing.
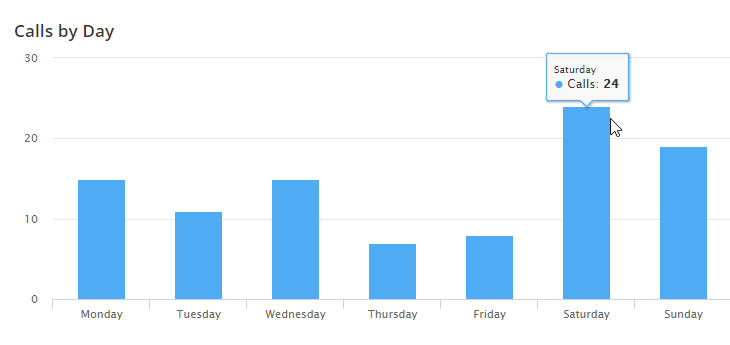
Calls by Day Graph
This graph provides a visual to help determine the busiest days of the week for calls from the Google business listing. Hover over the bar for any day of the week to view the actual number of calls initiated from the GMB listing.
This graph provides a visual to help determine the busiest days of the week for calls from the Google business listing. Hover over the bar for any day of the week to view the actual number of calls initiated from the GMB listing.
Calls by Hour Graph
This graph can help you determine the busiest hours of the day for calls made by people clicking the call button on a Google business listing.
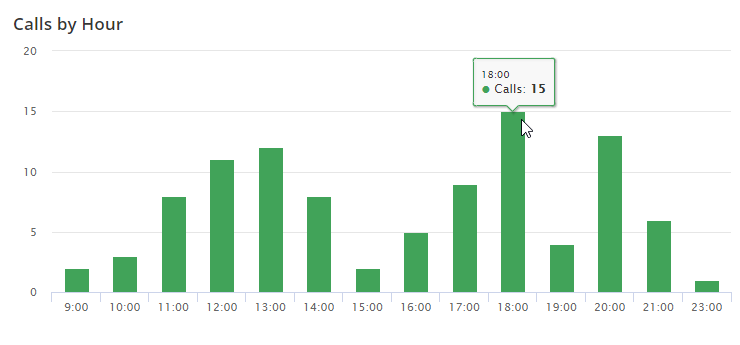
This graph can help you determine the busiest hours of the day for calls made by people clicking the call button on a Google business listing.
Photo Quantity Chart
This chart visually details the number of currently published photos that have been uploaded to the Google My Business listing by customers vs. the business owner.
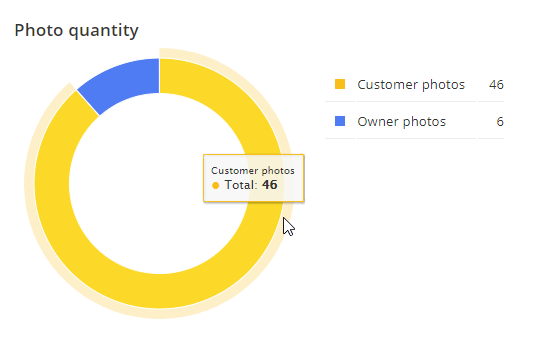
This chart visually details the number of currently published photos that have been uploaded to the Google My Business listing by customers vs. the business owner.
Photo Views Graph
Hover over any date bar in this graph to discover the number of views that media received for each date, with a comparison of photos uploaded by customers vs. those uploaded by the merchant.
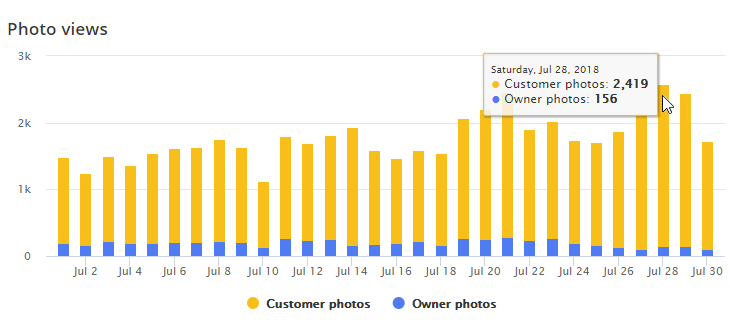
Hover over any date bar in this graph to discover the number of views that media received for each date, with a comparison of photos uploaded by customers vs. those uploaded by the merchant.
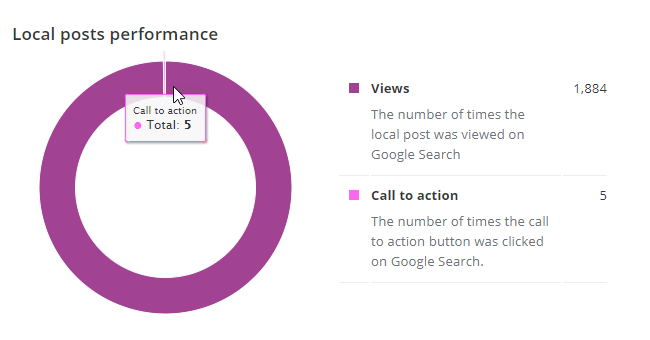
Local Post Views & Calls to Action Chart
Discover the number of views a local post received in Google Search and the number of times the listing's call to action button was clicked.
Discover the number of views a local post received in Google Search and the number of times the listing's call to action button was clicked.
Local Post Performance Graph
This graph provides a daily breakdown of post views and call-to-action clicks. For a custom view of one of the metrics, click the metric name of the other below the graph to hide its display.
This graph provides a daily breakdown of post views and call-to-action clicks. For a custom view of one of the metrics, click the metric name of the other below the graph to hide its display.
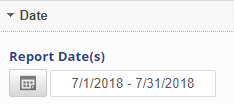 |
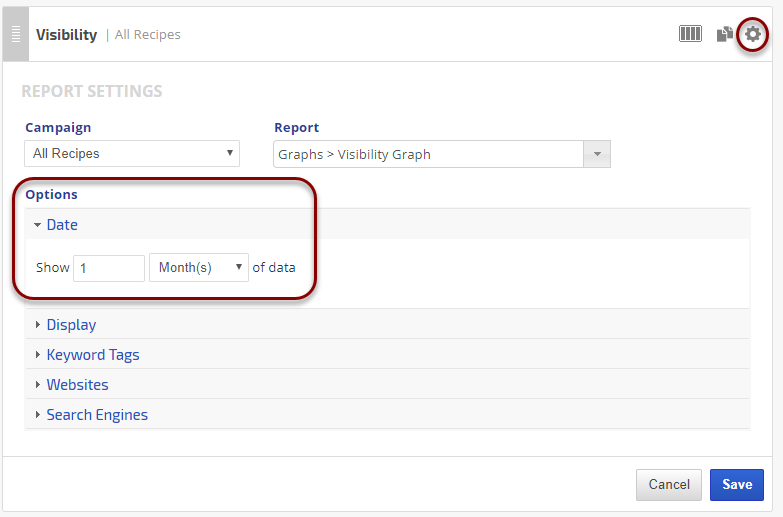
Date
|
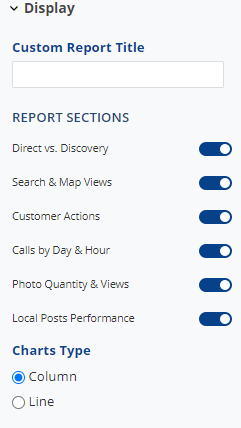 |
Display Settings
|
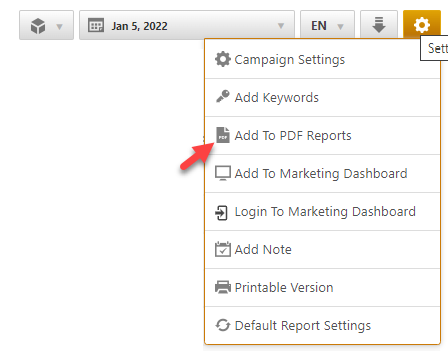
Add to PDF Report
Conveniently add a report or graph with its current settings to a PDF report by hovering over the gold gear icon and selecting Add to PDF Reports
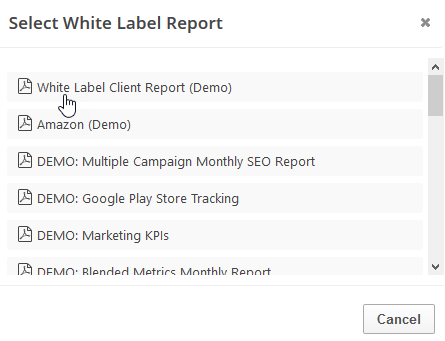
Select the PDF Report that you want the report or graph added to
Drag the new report or graph into the position you want it to display in the PDF and confirm that the Date settings do not conflict with the automated scheduling settings.
Add to Marketing Dashboard
Conveniently add a report or graph with its current settings to a marketing dashboard:
1. Hover over the gold gear icon and select Add to Marketing Dashboard
2. Select the Dashboard (campaign name)
3. Select the Dashboard Page that you want the report added to

1. Hover over the gold gear icon and select Add to Marketing Dashboard
2. Select the Dashboard (campaign name)
3. Select the Dashboard Page that you want the report added to
4. Click the "Go to Dashboard" link to further customize the report (e.g., drag it to a specific position on the page, change date settings, etc.)

Refer to the Report Options section for details regarding the display settings, filters and sort options available for this report.
The report date (or date range) is governed by the selected Dashboard date option: Date Selection or Fixed Periods, learn more...
- Daily reports default to the last day of the selected period
- Weekly and monthly reports default to 1 month of data