- Social Account Header
- Top Graph (with or without labels)
- Followers Analysis
- Reach Chart
- Updates Table of the most recent page posts
- SEO
- Rank Tracker
- Local SEO
- Mobile SEO
- Link Manager
- Landing Pages
- Social Signals
- On-Page Optimization
- Enterprise SEO Solutions
- Marketing
- Competition Analysis
- Insight Graph
- Keyword Research
- Graphs & Widgets
- Market Reach
- Marketing KPI
- Brand Visibility
- White Label SEO
- Marketing Dashboard
- Client Dashboard
- PDF Reports
- PDF Templates
- Other
- Email Notifications
- Portfolio Management
- Integrations
- Google Analytics
- Search Console
- Pay Per Click
- WeDevelop
- API
LinkedIn Page Analytics
The LinkedIn Page Analytics report provides an overview of follower and reach trends, audience analysis and detailed post performance. This modular report allows for display of all or specific sections (refer to Report Options > Display settings), providing flexibililty in white label reporting. Sections include:
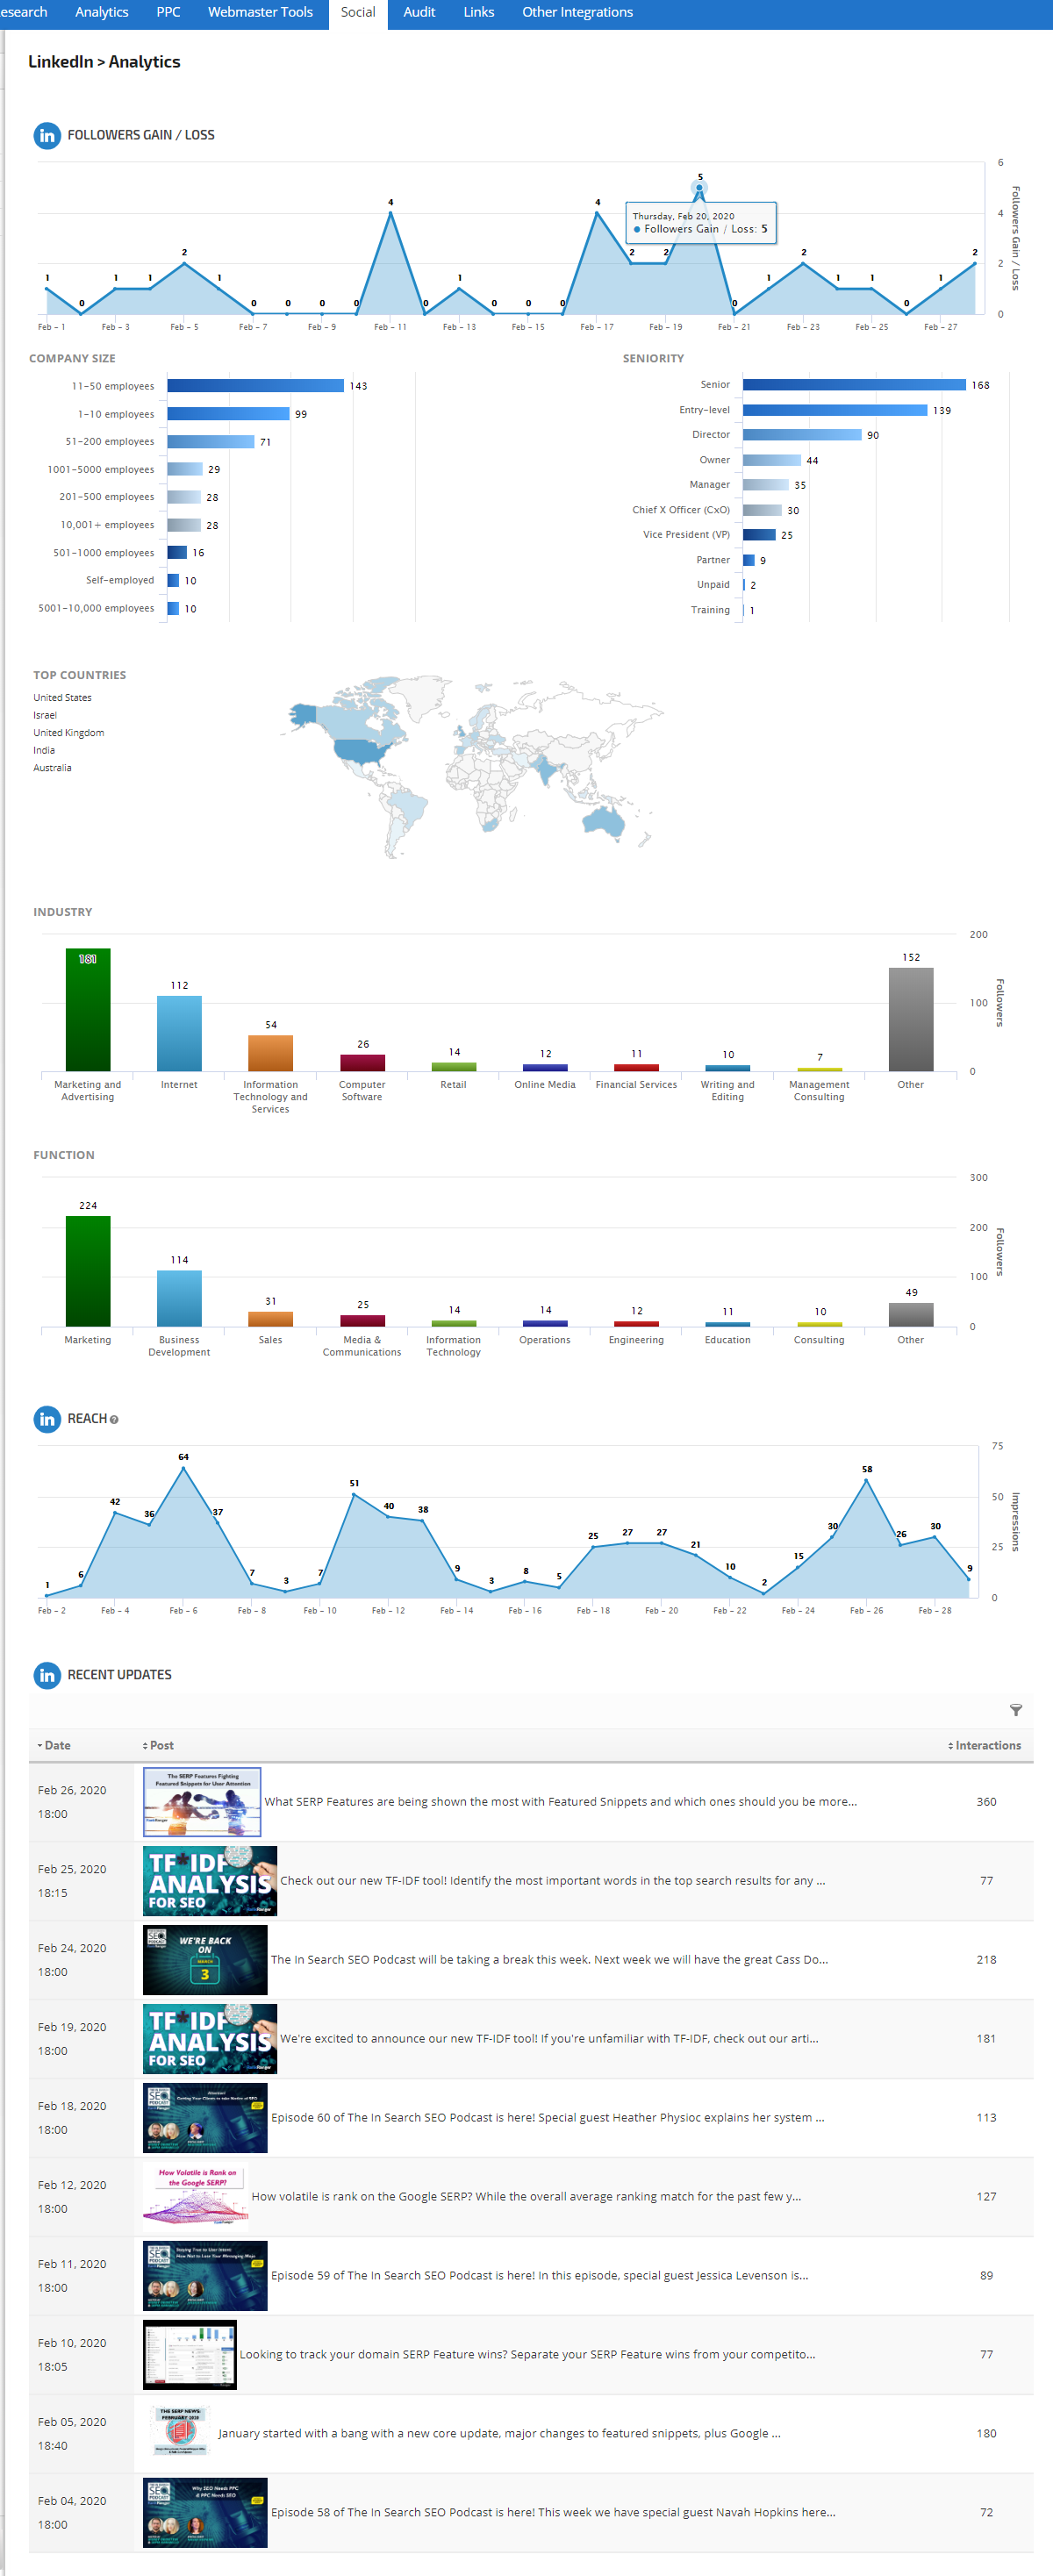
Located in Reports > Social
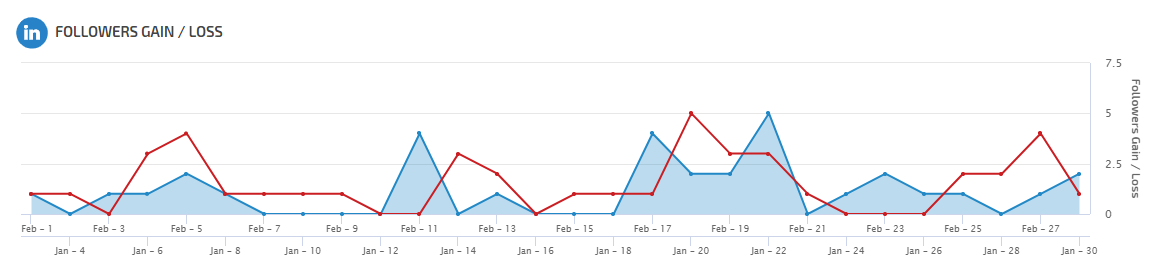
Top Graph for Trends Analysis
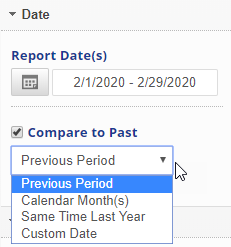
In the Report Options Date settings you may select to compare to past (the red line in this example) and in Social Analytics settings you may select one of these key metric for this graph:
In the Report Options Date settings you may select to compare to past (the red line in this example) and in Social Analytics settings you may select one of these key metric for this graph:
- Total Followers
- Organic Followers
- Aquired Followers
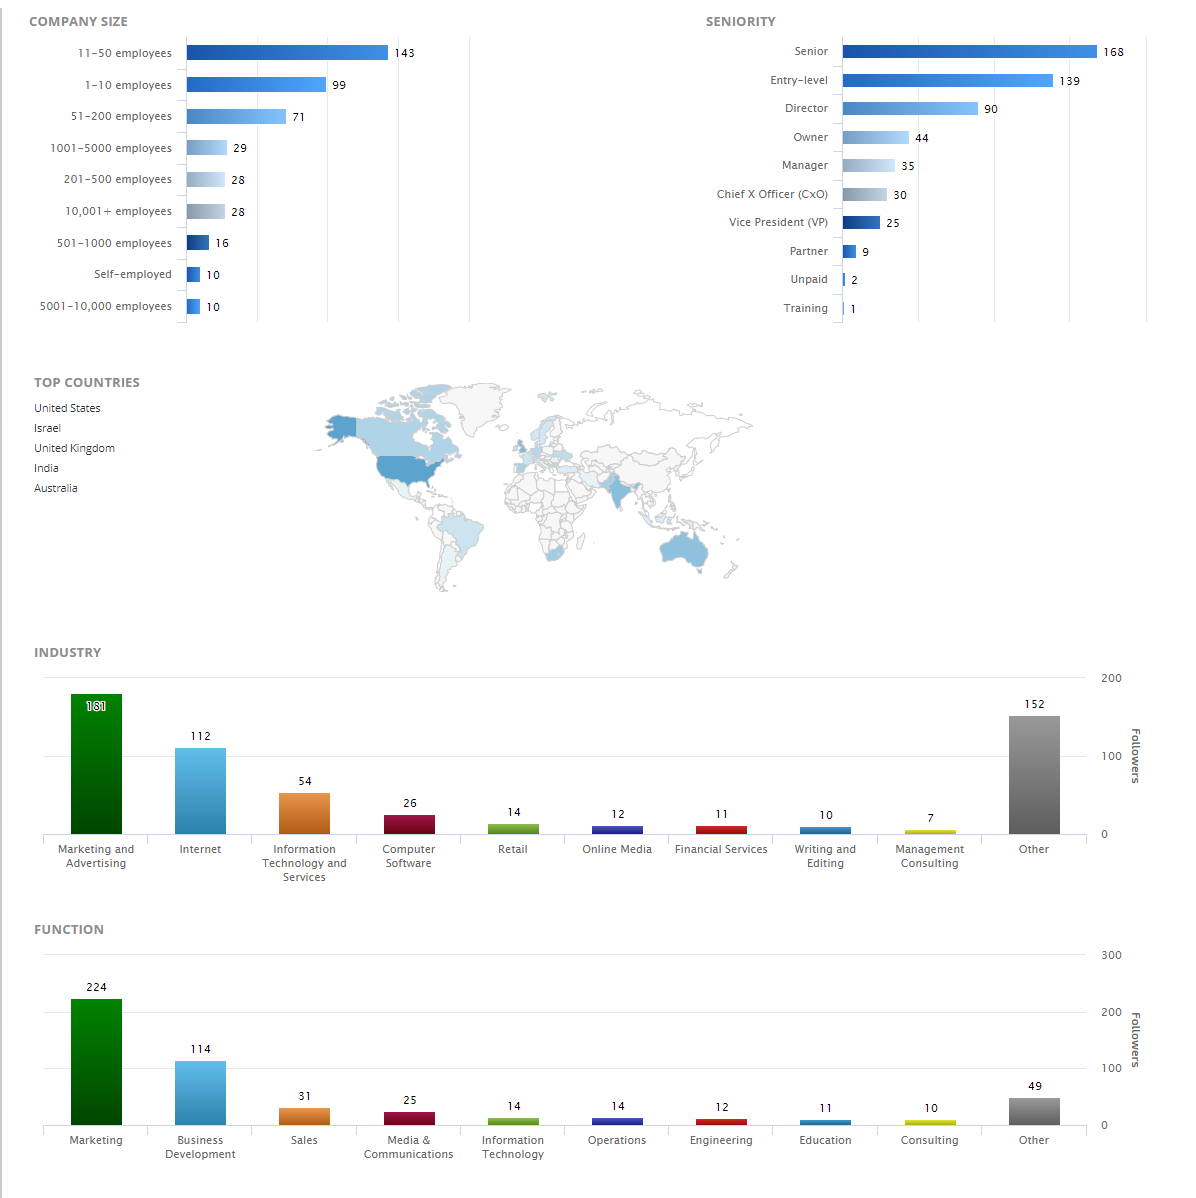
Audience Demographics
In the Followers section, the report provides a breakdown of the following data for the LinkedIn users who are following your page:
In the Followers section, the report provides a breakdown of the following data for the LinkedIn users who are following your page:
- Country Size
- Seniority
- Top Countries
- Industry
- Job Function
Page Post Reach
This Reach chart represents the number of times per day that your page updates were seen, both organically and through paid campaigns, on a daily basis. Note that dates are determined using GMT.

This Reach chart represents the number of times per day that your page updates were seen, both organically and through paid campaigns, on a daily basis. Note that dates are determined using GMT.
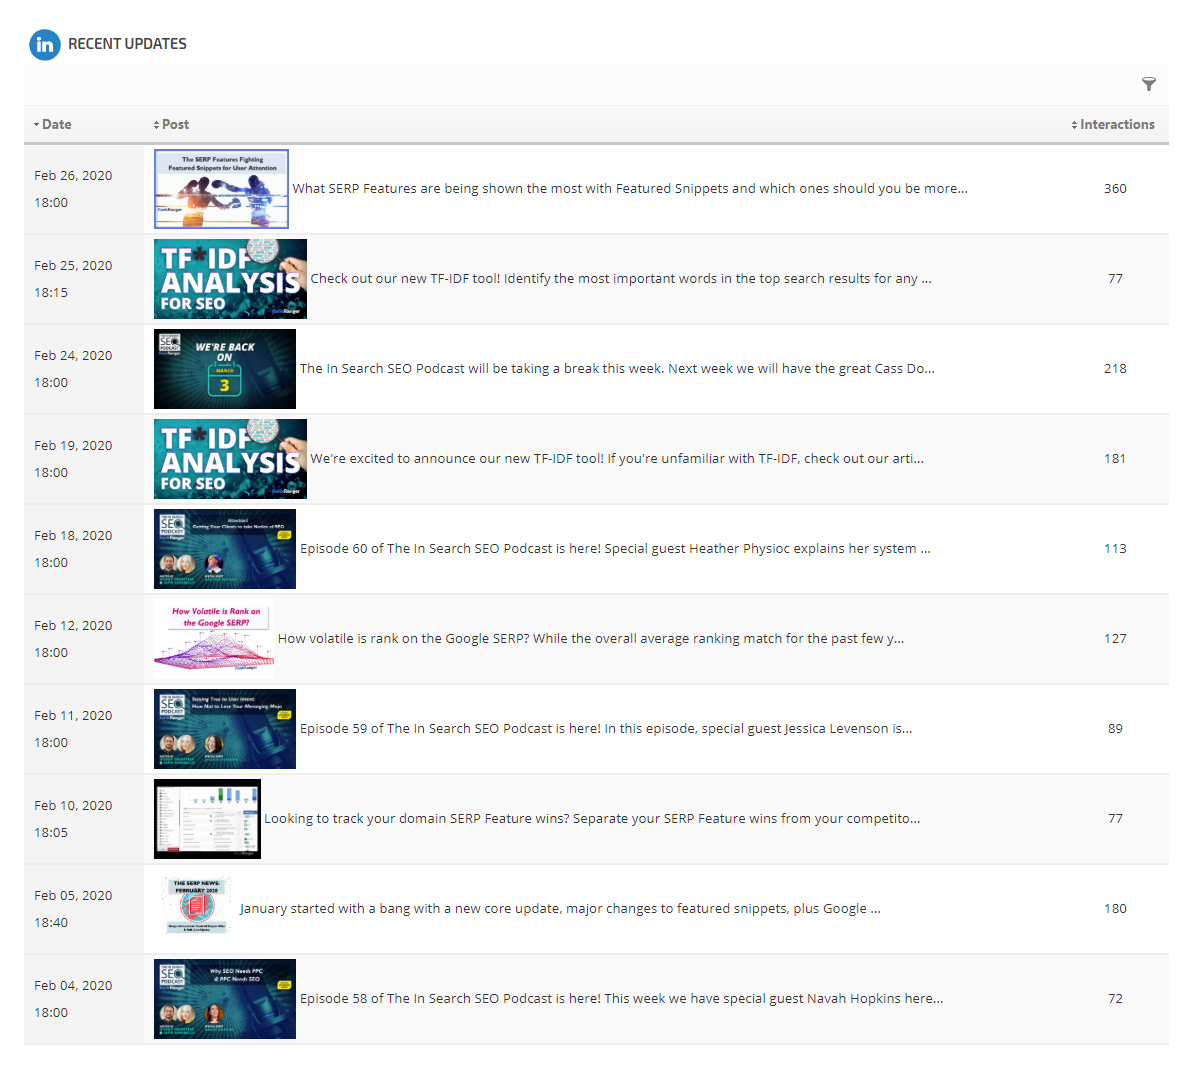
Recent Updates
Included in this section:
Included in this section:
- Post date and time
- Post image thumbnail (if applicable) and content snippet
- Number of Interactions with the post
 |
Date
|
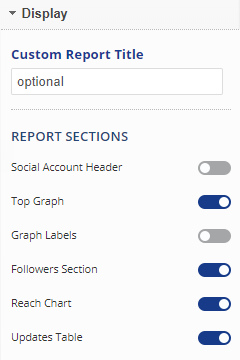 |
Display
|
 |
Social Analytics
|