- Site Statistics
- Errors
- Warnings
- Notices
- SEO
- Rank Tracker
- Local SEO
- Mobile SEO
- Link Manager
- Landing Pages
- Social Signals
- On-Page Optimization
- Enterprise SEO Solutions
- Marketing
- Competition Analysis
- Insight Graph
- Keyword Research
- Graphs & Widgets
- Market Reach
- Marketing KPI
- Brand Visibility
- White Label SEO
- Marketing Dashboard
- Client Dashboard
- PDF Reports
- PDF Templates
- Other
- Email Notifications
- Portfolio Management
- Integrations
- Google Analytics
- Search Console
- Pay Per Click
- WeDevelop
- API
Site Audit Compare to Previous Audit
The Site Audit Compare report makes it possible to compare the results of 2 audits side-by-side, along with an indicator of positive and negative change. Included are:
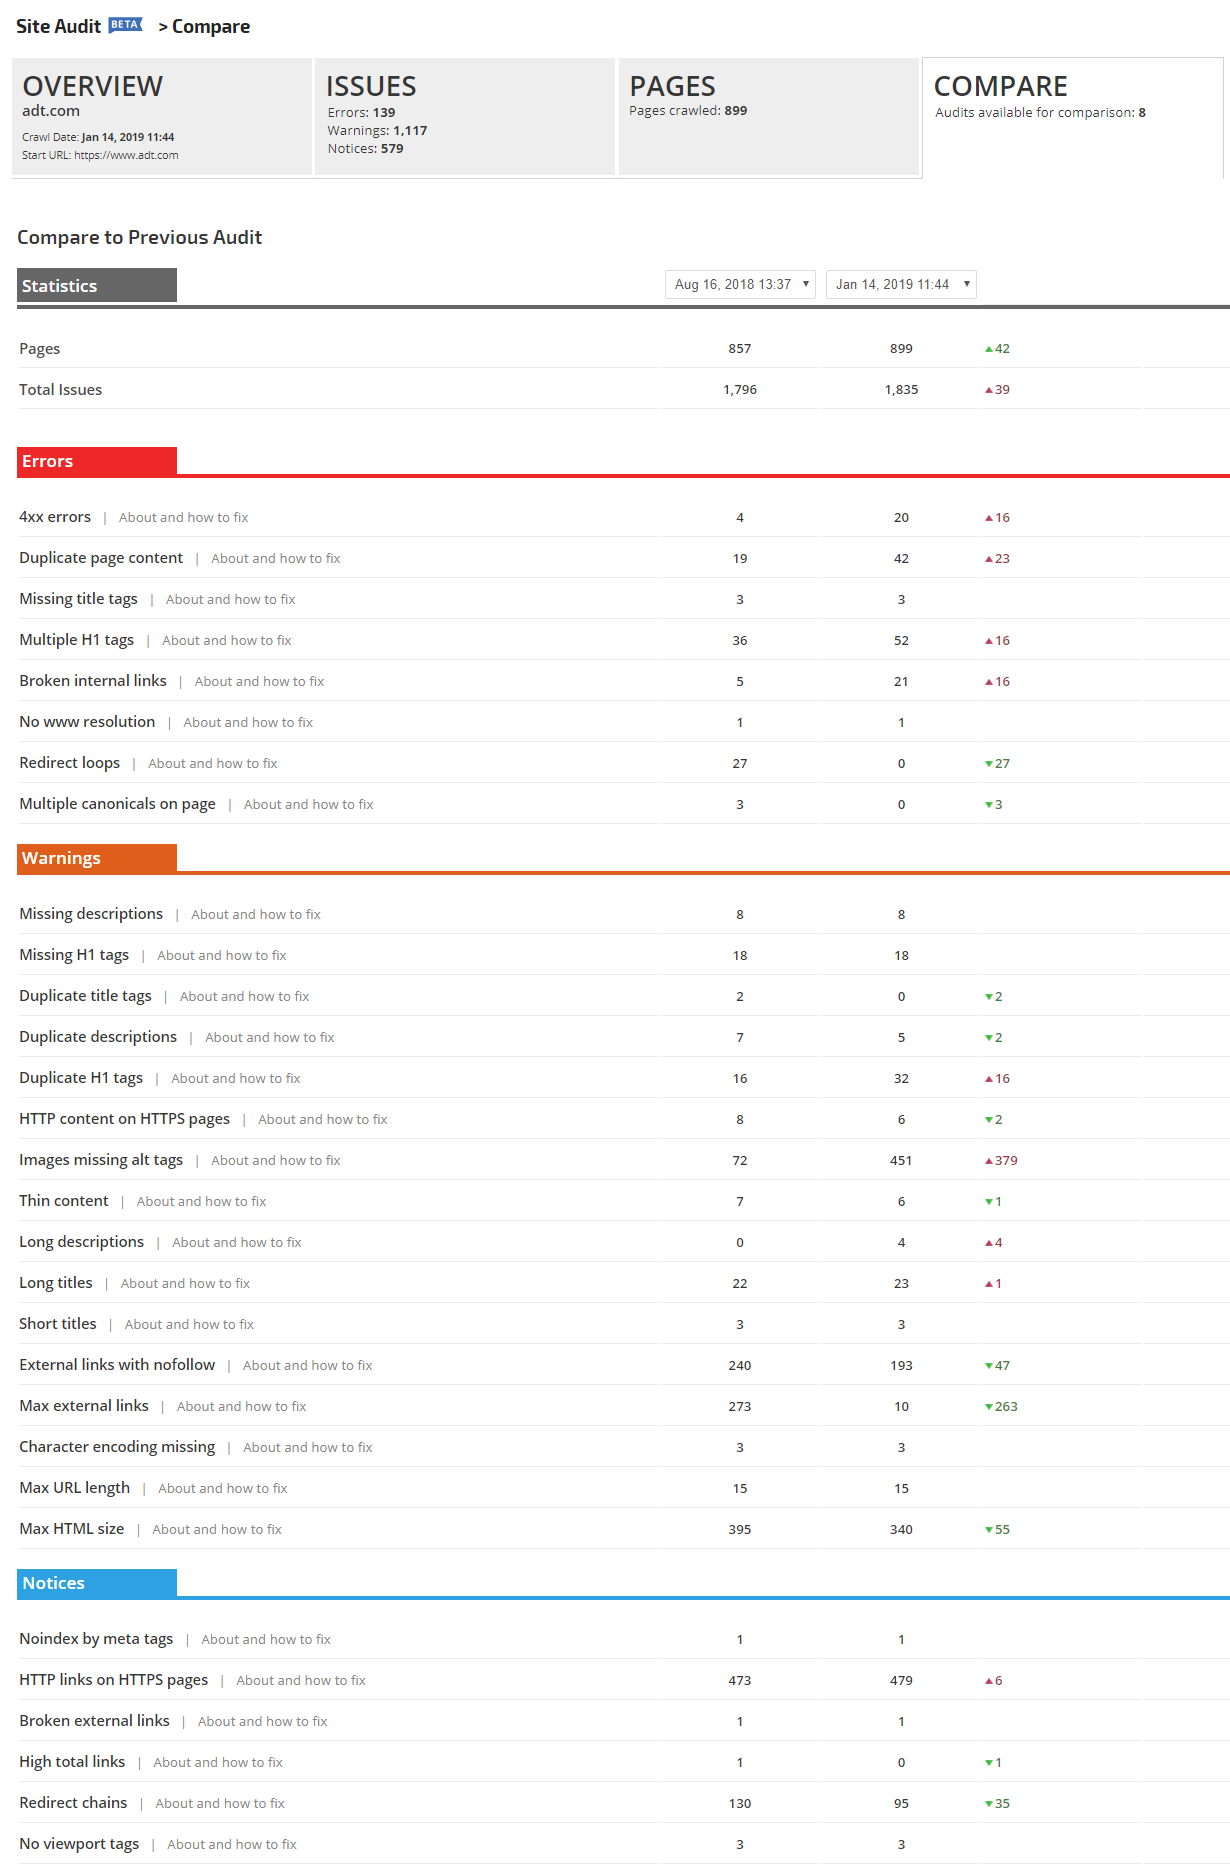
Located in Reports & Tools > Organic Search > SEO Audit
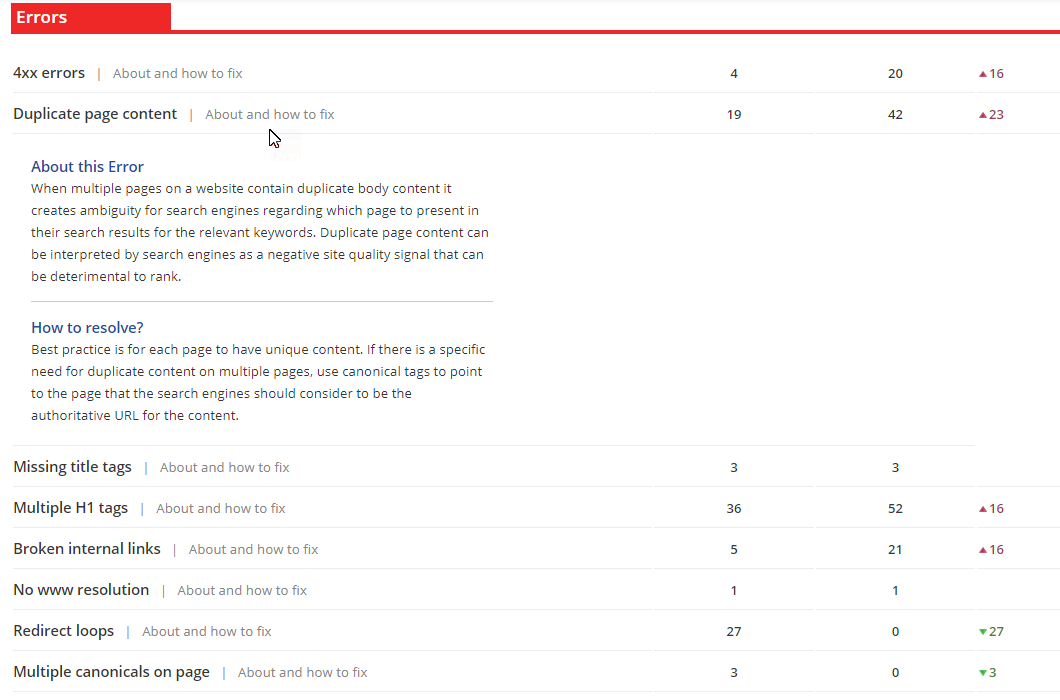
Errors are serious issues that can negatively affect SEO or user interaction with the site. Click the "About and how to fix" link for an explanation of what the error message means, and a recommendation for how to fix it.
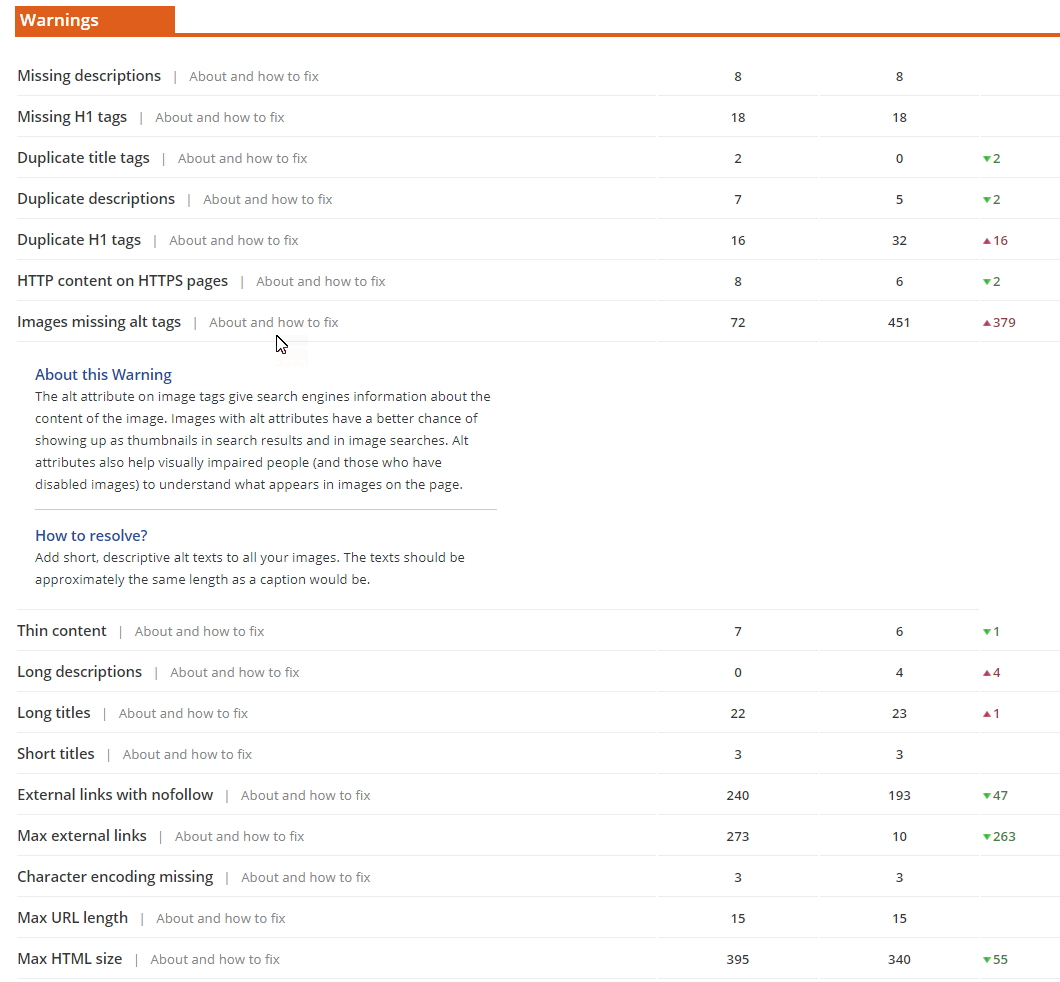
Issued listed in the Warnings section have the potential to damage search engine ranking, as well as reduce the possibility of a searcher clicking through to the site.
Although less serious than Errors, remedying the items listed in the Notices section can improve SEO or user experience.

 |
Dates
|
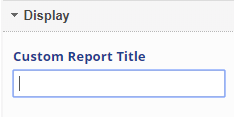 |
Display
|
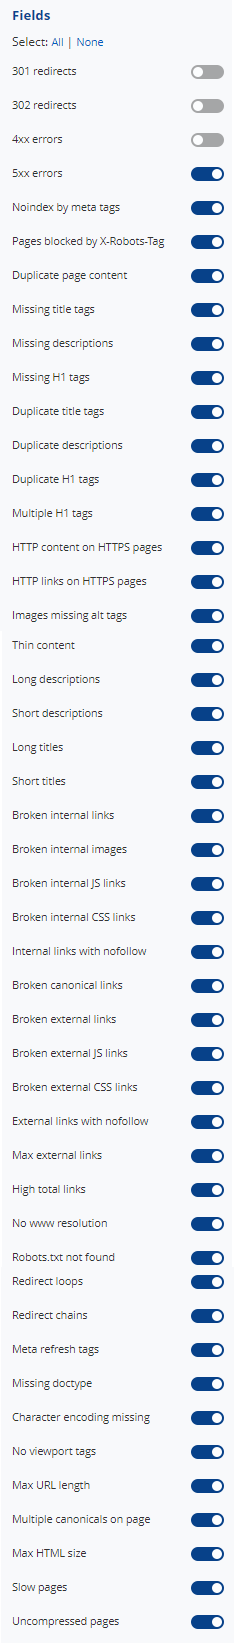 |
Fields
|
|
Add to PDF Report
Conveniently add a report or graph with its current settings to a PDF report by hovering over the gold gear icon and selecting Add to PDF Reports
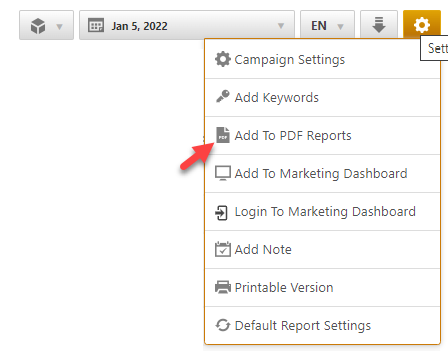
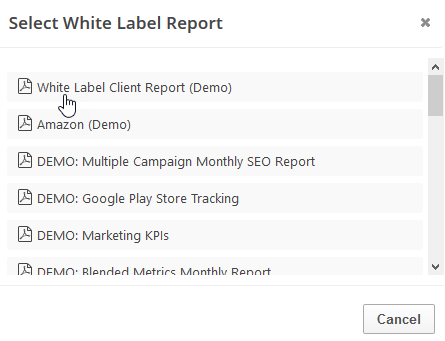
Select the PDF Report that you want the report or graph added to
Drag the new report or graph into the position you want it to display in the PDF and confirm that the Date settings do not conflict with the automated scheduling settings.
Add to Marketing Dashboard
Conveniently add a report or graph with its current settings to a marketing dashboard:
1. Hover over the gold gear icon and select Add to Marketing Dashboard
2. Select the Dashboard (campaign name)
3. Select the Dashboard Page that you want the report added to

1. Hover over the gold gear icon and select Add to Marketing Dashboard
2. Select the Dashboard (campaign name)
3. Select the Dashboard Page that you want the report added to
4. Click the "Go to Dashboard" link to further customize the report (e.g., drag it to a specific position on the page, change date settings, etc.)

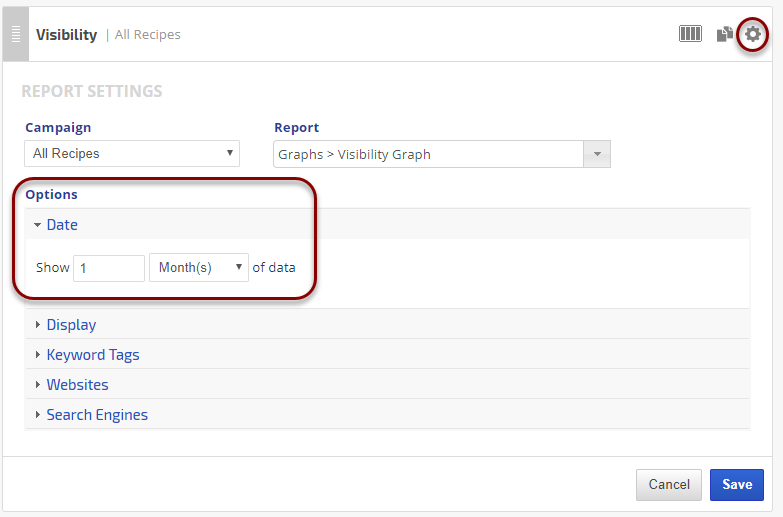
Refer to the Report Options section for details regarding the display settings, filters and sort options available for this report.
The report date (or date range) is governed by the selected Dashboard date option: Date Selection or Fixed Periods, learn more...
- Daily reports default to the last day of the selected period
- Weekly and monthly reports default to 1 month of data
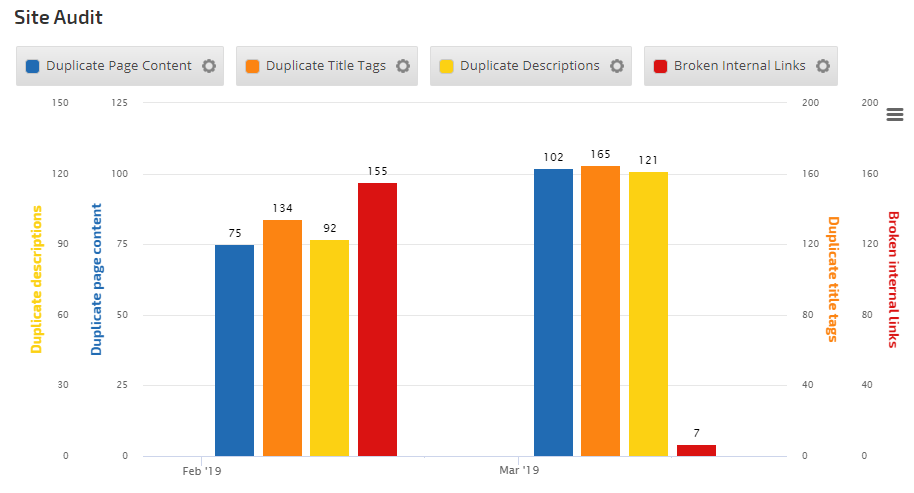
Site Audit Insight Graph
Data from Site Audits and Site Audit Comparisons can be added to Insight Graphs for viewing progress.
Add a Metric
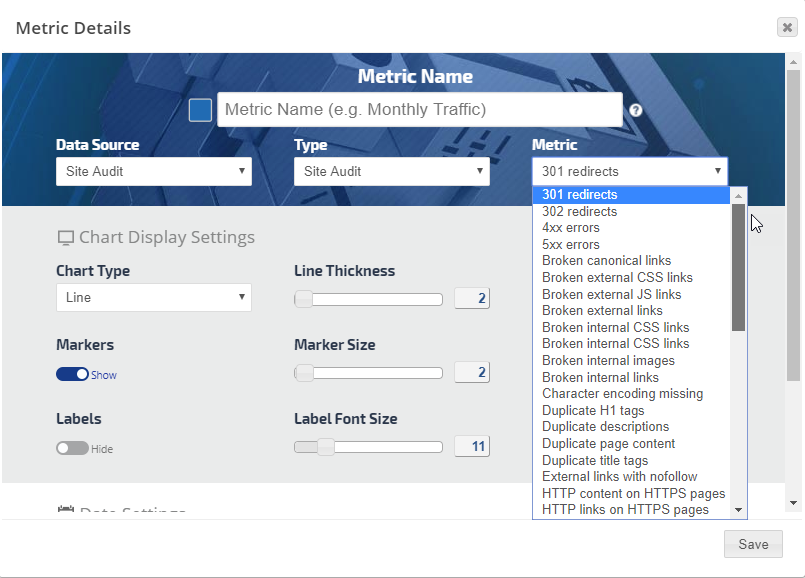
- In the Data Source menu select Site Audit
- In the Metric menu select one of the available Site Audit metrics
- Add the Metric Name, select a color and the chart display settings you want and click the Save button
Site Audit Insight Graph example