- Social Account Header
- Top Graph (with or without labels)
- Lifetime Totals
- Performance Totals
- Post & Mentions
- Engagements
- SEO
- Rank Tracker
- Local SEO
- Mobile SEO
- Link Manager
- Landing Pages
- Social Signals
- On-Page Optimization
- Enterprise SEO Solutions
- Marketing
- Competition Analysis
- Insight Graph
- Keyword Research
- Graphs & Widgets
- Market Reach
- Marketing KPI
- Brand Visibility
- White Label SEO
- Marketing Dashboard
- Client Dashboard
- PDF Reports
- PDF Templates
- Other
- Email Notifications
- Portfolio Management
- Integrations
- Google Analytics
- Search Console
- Pay Per Click
- WeDevelop
- API
Twitter Analytics
The Twitter Analytics report provides the data needed to analyze social KPIs, monitor trends, and measure engagement, plus includes the flexibility to add specific report sections to white label dashboards and PDF reports for sharing with clients and coworkers. Sections include:

Located in Reports & Tools > Digital Marketing > Social Media
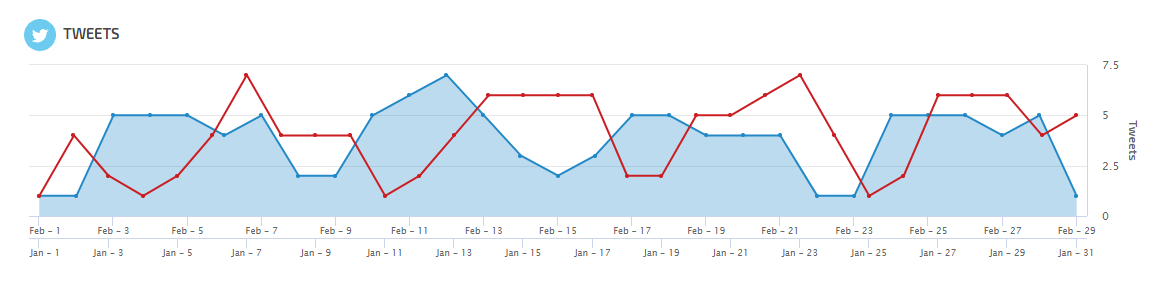
Top Graph for Trends Analysis
In the Report Options Date settings you may select to compare to past (the red line in this example) and in Social Analtyics settings you can select from a variety of key metrics to trend in this graph.
In the Report Options Date settings you may select to compare to past (the red line in this example) and in Social Analtyics settings you can select from a variety of key metrics to trend in this graph.
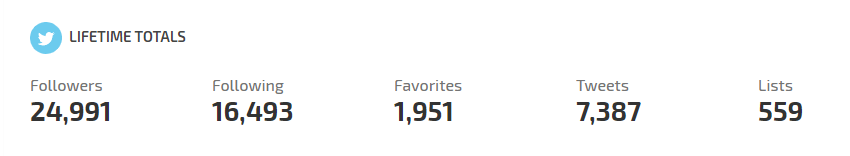
Lifetime Totals
In this section, the report provides the total number of Followers, Following, Favorites, Tweets and Lists for the lifetime of the account. If you enable the compare to past feature in date settings, you'll see the change from the previous period.
In this section, the report provides the total number of Followers, Following, Favorites, Tweets and Lists for the lifetime of the account. If you enable the compare to past feature in date settings, you'll see the change from the previous period.
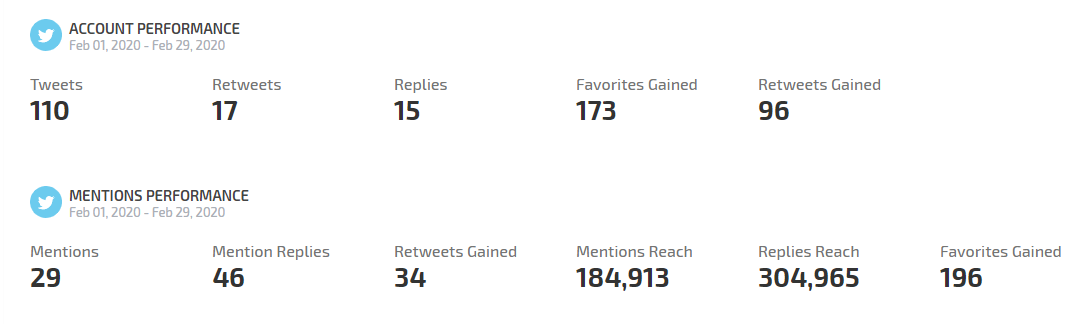
Account & Mentions KPIs
In the Account Performance section, the numbers relate to the report period. In Report Options > Date settings you can enable a compare to past feature to add an indicator of the percent of chance between the 2 report periods.
In the Account Performance section, the numbers relate to the report period. In Report Options > Date settings you can enable a compare to past feature to add an indicator of the percent of chance between the 2 report periods.
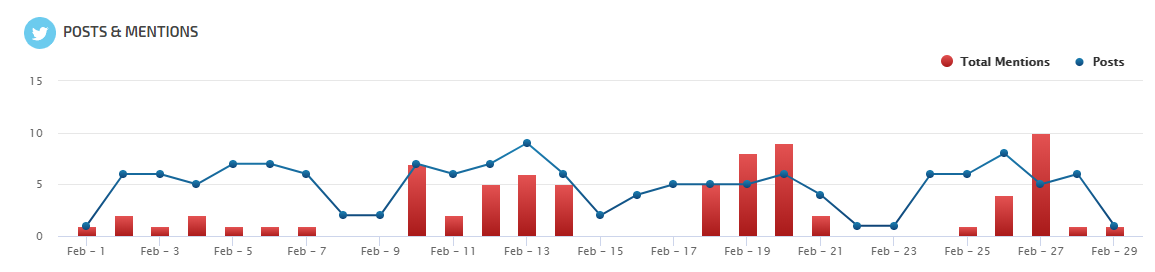
Post Performance
The number of posts and mentions per day display in this trend graph.
The number of posts and mentions per day display in this trend graph.
Organic Trends
The focus of the Engagements section is audience interaction with your posts: Retweets, Favorites, Replies and Mentions.

The focus of the Engagements section is audience interaction with your posts: Retweets, Favorites, Replies and Mentions.
 |
Date
|
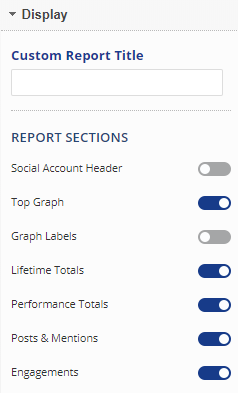 |
Display
|
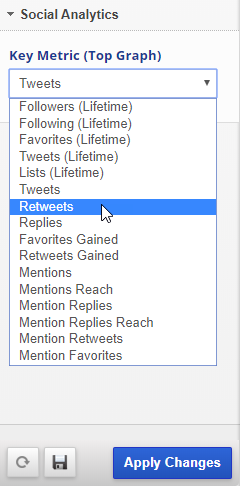 |
Key MetricSelect one metric to display in the top graph
|