View your website's visibility on search engines and visually compare it to your competitors in this colorful graph that also provides options for display of Google Algorithm Changes, Events, and Notes. Visibility is based on the position of ranking keywords and average search volume.
The Visibility Score takes into account all tracked keywords for a campaign, but can be adjusted to exclude certain keywords or search engines, however, the default settings will show the average of all keywords across all search engines being tracked in the campaign.
Visibility Score is calculated per keyword for keywords that are ranking in the top 30 search engine results for each search engine tracked in the campaign.
Keywords can score up to 500 in our system, but we only calculate Visibility Score for keywords in Top 30, meaning that if a keyword is ranked in position 31 or 499 it will be assigned a Visibility Score of 0. This is based on research of average user behavior indicating that approximately 75% of users never scroll beyond the 1st page of search results. Therefore, Visibility value for a keyword is based on the rank position, i.e., a keyword that ranks #1 will have a higher value than a keyword that is ranked #4.
The total of the campaign keywords' visibility scores (including those that score 0) results in the campaign's daily Visibility Score. The higher the daily score, the better the site's visibility. The idea is to improve from the baseline Visibility Score over time with the goal of improving click-thru and site traffic.
- SEO
- Rank Tracker
- Local SEO
- Mobile SEO
- Link Manager
- Landing Pages
- Social Signals
- On-Page Optimization
- Enterprise SEO Solutions
- Marketing
- Competition Analysis
- Insight Graph
- Keyword Research
- Graphs & Widgets
- Market Reach
- Marketing KPI
- Brand Visibility
- White Label SEO
- Marketing Dashboard
- Client Dashboard
- PDF Reports
- PDF Templates
- Other
- Email Notifications
- Portfolio Management
- Integrations
- Google Analytics
- Search Console
- Pay Per Click
- WeDevelop
- API
Visibility Graph

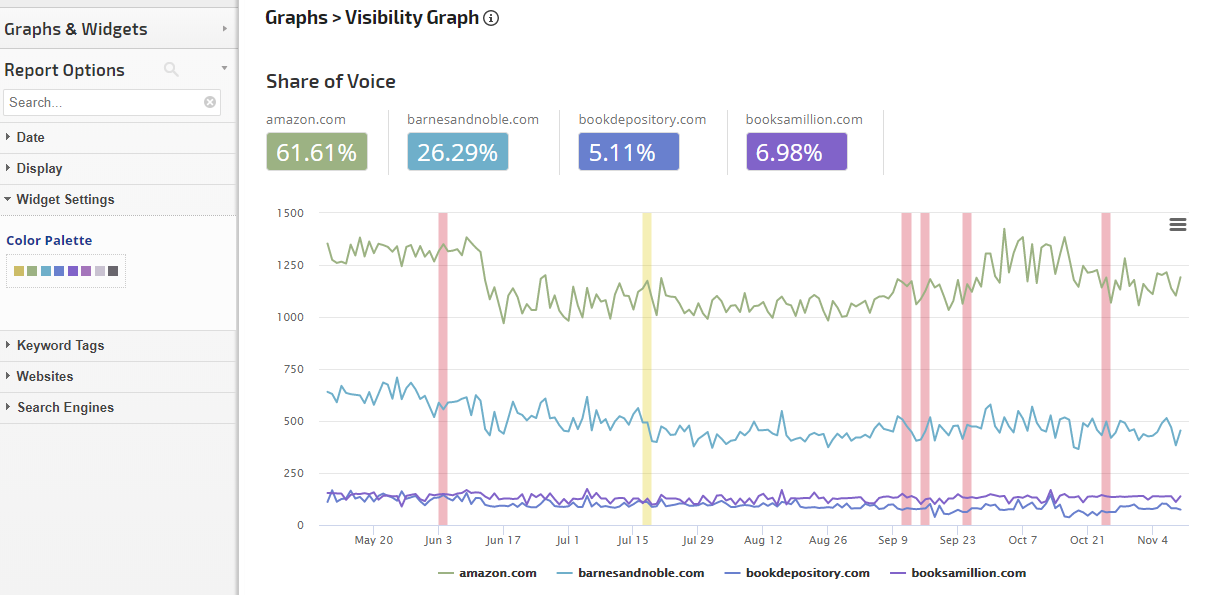
Competitive Visibility Share
In this example, the Visibility Share % option is enabled, producing a summary above the graph that details the percentage share of the campaign website compared to tracked competitor domains.
In this example, the Visibility Share % option is enabled, producing a summary above the graph that details the percentage share of the campaign website compared to tracked competitor domains.
Color Your Graph
The above image displays the default color scheme for the Insight Graph, you may choose from 35+ color palettes to match the theme of your marketing dashboards.

The above image displays the default color scheme for the Insight Graph, you may choose from 35+ color palettes to match the theme of your marketing dashboards.
How to select a color palette
In Report Options, expand the Widget Settings and click the current palette. That launches the color option list, click the color palette you want and then click the Apply Changes button at the bottom of the sidebar.
In Report Options, expand the Widget Settings and click the current palette. That launches the color option list, click the color palette you want and then click the Apply Changes button at the bottom of the sidebar.
This is an example of the visibility and rank graph displayed in the Rank > Dashboard.
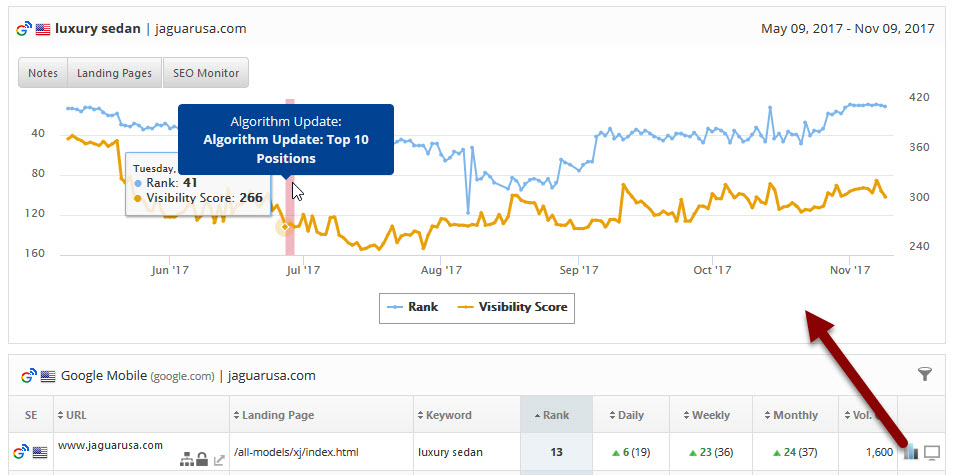
The Rank is specific to the selected keyword and search engine. The Visibility Score takes into account all tracked keywords for a particular campaign for the selected search engine and, therefore, differs from the Rank as it is not specific to a keyword, but rather an average score of visibility for the website.
Visibility Score added to a ranking graph improves the ability to see how the entire campaign is performing in comparison to fluctuations for a specific keyword.
You can also add the Visibility metric to an Insight Graph and create a custom graph with blended metrics, refer to the Insight Graph section below the options for this graph.
The Rank is specific to the selected keyword and search engine. The Visibility Score takes into account all tracked keywords for a particular campaign for the selected search engine and, therefore, differs from the Rank as it is not specific to a keyword, but rather an average score of visibility for the website.
Visibility Score added to a ranking graph improves the ability to see how the entire campaign is performing in comparison to fluctuations for a specific keyword.
Custom Graphs
You can also add the Visibility metric to an Insight Graph and create a custom graph with blended metrics, refer to the Insight Graph section below the options for this graph.
 |
Date:Select:
|
 |
Display Settings:
|
|
Widget Settings:
|
 |
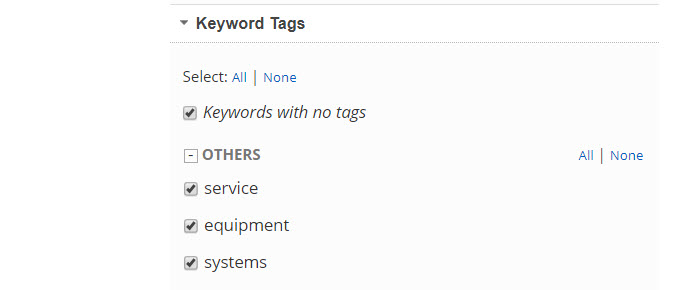
Keyword Tags:
|
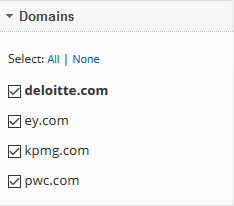 |
Websites:
|
Search Engines
|
Visibility Insight Graph
Using the Insight Graph it is possible to create a Visibility Graph with associated performance metrics, here are a few examples:
Visibility Score, Search Console Impressions and Clicks
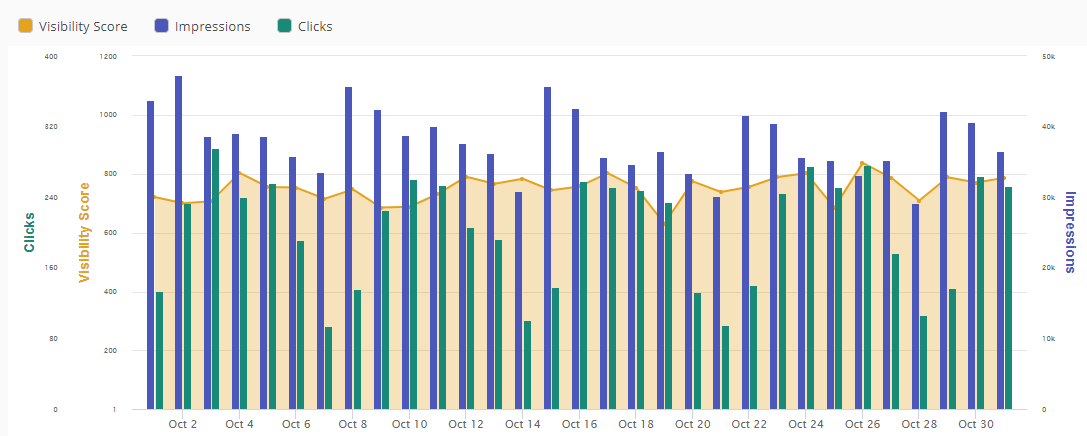
Visibility Score, Search Console Impressions and Clicks
Site Visibility Multiple Search Engine Comparison
If you're tracking rank in multiple countries for an e-commerce site, for example, the Insight Graph has an enterprise feature that allows for cross-campaign metrics to be added. In this example, we've compared the search engine visibility in the UK and US on Bing organic, and Google organic and mobile.
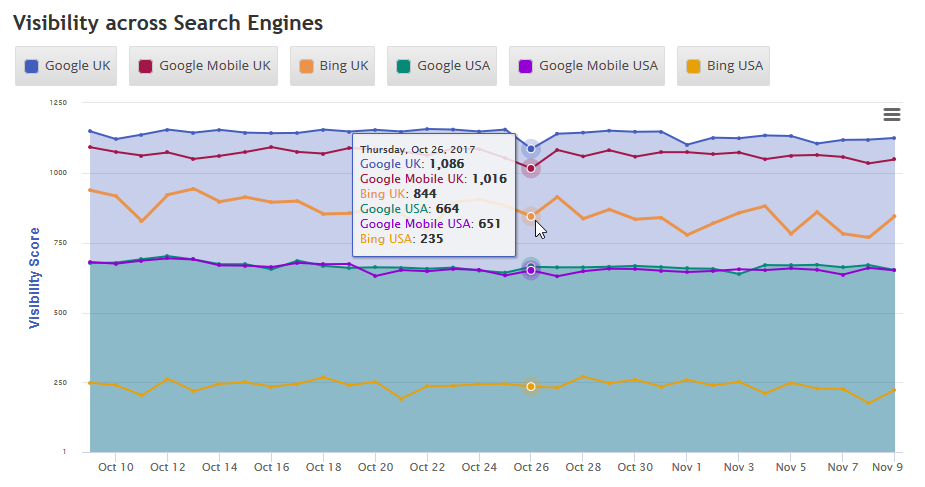
If you're tracking rank in multiple countries for an e-commerce site, for example, the Insight Graph has an enterprise feature that allows for cross-campaign metrics to be added. In this example, we've compared the search engine visibility in the UK and US on Bing organic, and Google organic and mobile.
Visibility Metrics Options
Visibility is based on the position of ranking keywords and average search volume. The Visibility Score takes into account all tracked keywords for a website but can be adjusted to exclude certain keywords or search engines by using filters, however, the default settings will show the average of all keywords across all search engines being tracked for a website. The Visibility Score can also be presented as a percentage value.
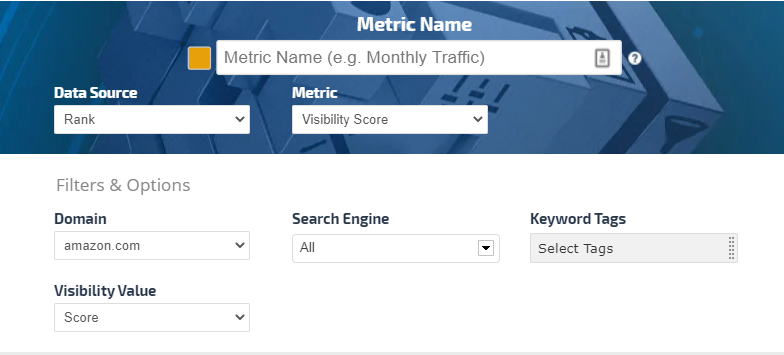
Visibility is based on the position of ranking keywords and average search volume. The Visibility Score takes into account all tracked keywords for a website but can be adjusted to exclude certain keywords or search engines by using filters, however, the default settings will show the average of all keywords across all search engines being tracked for a website. The Visibility Score can also be presented as a percentage value.
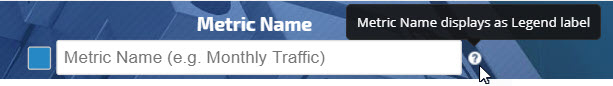
Metric Name
Enter the name that you want to be displayed as the legend label
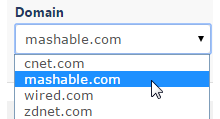
Domain
Select from the list of domains being tracked for the campaign
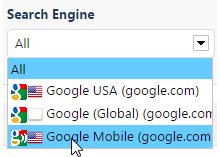
Search Engine
Select All or one specific Search Engine
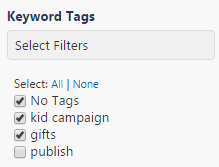
Keyword Tags
Click in the Select Filters field and select the keyword tags you want to filter rank data for in the graph
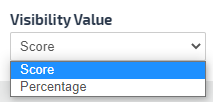
Visibility Value
Select Score or Percentage to display the value of the Visibility either as a number or as a percentage value.
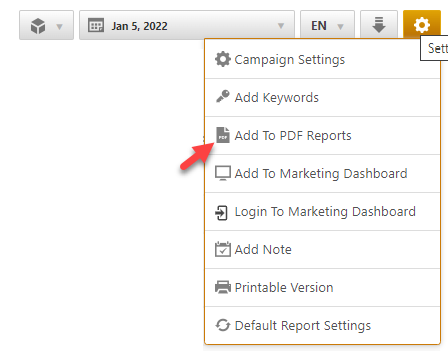
Add to PDF Report
Conveniently add a report or graph with its current settings to a PDF report by hovering over the gold gear icon and selecting Add to PDF Reports
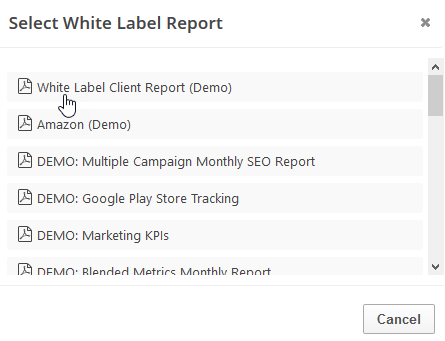
Select the PDF Report that you want the report or graph added to
Drag the new report or graph into the position you want it to display in the PDF and confirm that the Date settings do not conflict with the automated scheduling settings.
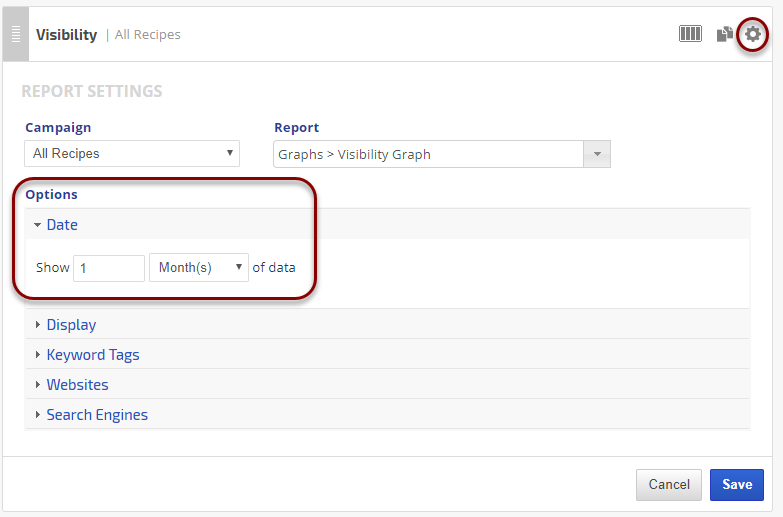
PDF Report Settings - Visibility Graph
Reports and graphs can be added to automated PDF reports via the report screen (as described above) or manually in the PDF Report Content screen. If the report is added via the:
- report screen, then begin by clicking the Edit button corresponding to the report
- PDF Report Content screen, then click the Add Report button and select the Campaign name and Report: Visibility Graph.
 |
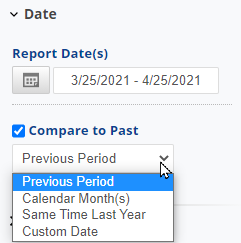
DateExpand the Date Options section and in the Show Report date of the last field type in the number of periods to be displayed in the report In the next field select one of the following options:
|
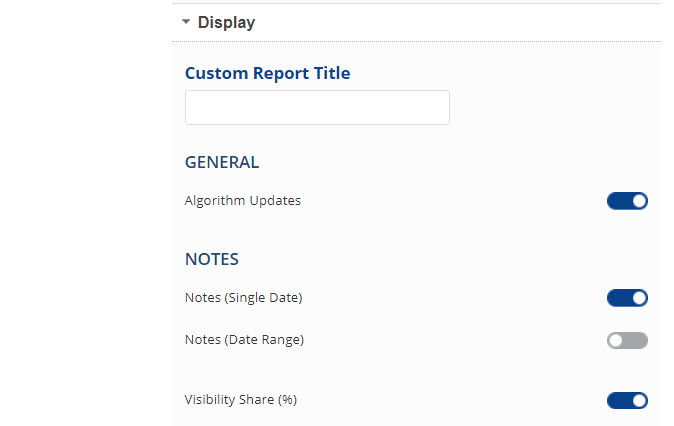 |
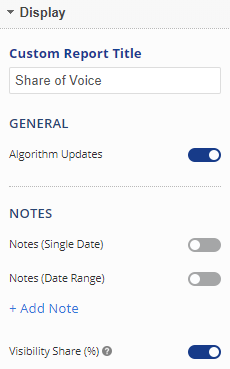
DisplayCustom Report Title (optional): Displays across the top of the report section. General Display the Google Algorithm Update indicator (displays on graph as a red bar and can be moused-over for details) by moving the slider to the right. Notes Display Notes by moving the slider to the right. Display Visibility Share (%) (percentage share of campaign website compared to competitor domains displayed) by moving the slider to the right. |
 |
TagsFilter the report for Keyword Tags by selecting specific tags |
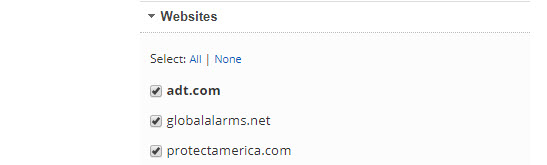 |
WebsitesSelect the Domain(s) to be displayed in the report. |
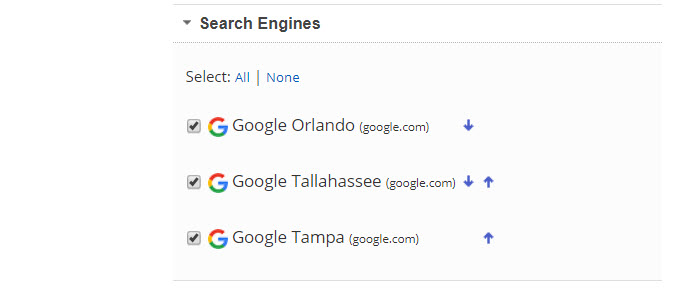 |
Search EnginesSelect the Search Engines to be displayed in the report. If multiple Search Engines are selected, you have the option to change the display order by clicking the arrow next to the Search Engine and dragging it into the desired order. |
Add to Marketing Dashboard
Conveniently add a report or graph with its current settings to a marketing dashboard:
1. Hover over the gold gear icon and select Add to Marketing Dashboard
2. Select the Dashboard (campaign name)
3. Select the Dashboard Page that you want the report added to

1. Hover over the gold gear icon and select Add to Marketing Dashboard
2. Select the Dashboard (campaign name)
3. Select the Dashboard Page that you want the report added to
4. Click the "Go to Dashboard" link to further customize the report (e.g., drag it to a specific position on the page, change date settings, etc.)

Refer to the Report Options section for details regarding the display settings, filters and sort options available for this report.
The report date (or date range) is governed by the selected Dashboard date option: Date Selection or Fixed Periods, learn more...
- Daily reports default to the last day of the selected period
- Weekly and monthly reports default to 1 month of data
Add to Client Dashboard
Customize Report for Client Dashboard
Client Dashboards display our default report options for each individual report and graph until you modify them. To customize the display of the report, expand the Report Options section, change the settings and click the Apply Changes button.
Then expand Report Options again and hover over the Save icon and select Save as Default for Client Dashboard.
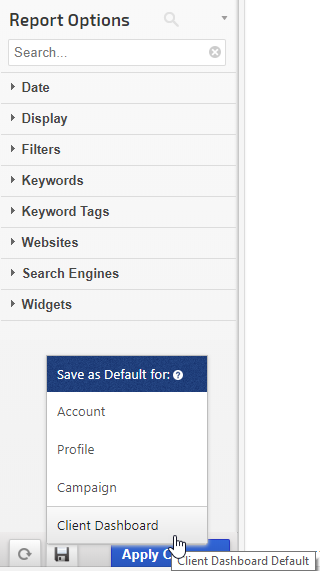
After saving the Client Dashboard default, any changes that you make to the report options will not affect the display in the Client Dashboard unless you overwrite it by following these instructions again.
Client Dashboards display our default report options for each individual report and graph until you modify them. To customize the display of the report, expand the Report Options section, change the settings and click the Apply Changes button.
Then expand Report Options again and hover over the Save icon and select Save as Default for Client Dashboard.
After saving the Client Dashboard default, any changes that you make to the report options will not affect the display in the Client Dashboard unless you overwrite it by following these instructions again.
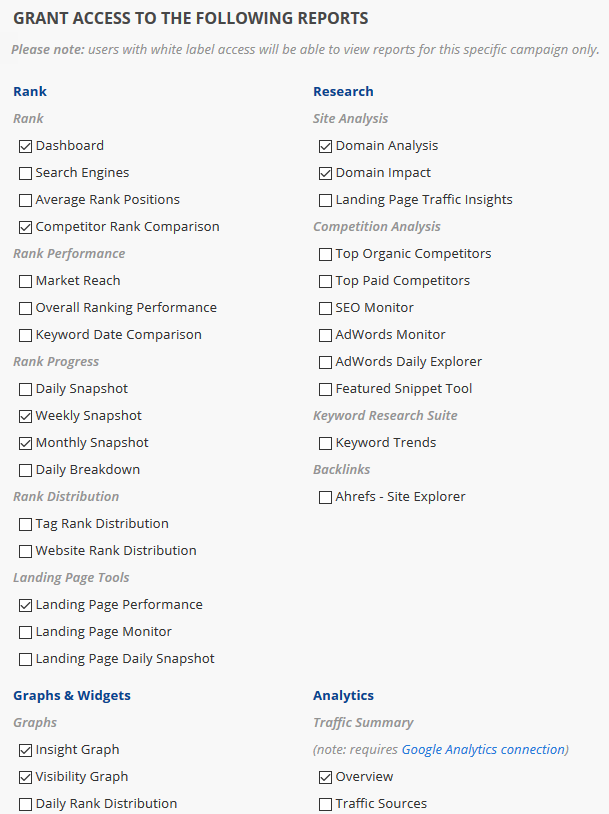
Enable the Report or Graph to display in the Client Dashboard
Open the Campaign Settings > Client Dashboard screen and check the box corresponding to the report(s) you want displayed in the dashboard, and then click the Save button.
Open the Campaign Settings > Client Dashboard screen and check the box corresponding to the report(s) you want displayed in the dashboard, and then click the Save button.
Refer to Client Dashboard Settings documentation for additional instructions for customizing your dashboard.