Keyword rank distribution, social signals, organic traffic and all traffic for specific landing pages are some of the options in our Landing Page Performance report. Filter and Sort selecting from a variety of parameters.
Weekly data updates accumulate for historical data that can be used for comparative trending. In one view, see the performance of an exact URL as ranked for your keywords. A click on the page URL reveals the keywords. Rankings are grouped into value based sets and can be viewed for all, or only specific, Search Engines being tracked in a campaign.
- SEO
- Rank Tracker
- Local SEO
- Mobile SEO
- Link Manager
- Landing Pages
- Social Signals
- On-Page Optimization
- Enterprise SEO Solutions
- Marketing
- Competition Analysis
- Insight Graph
- Keyword Research
- Graphs & Widgets
- Market Reach
- Marketing KPI
- Brand Visibility
- White Label SEO
- Marketing Dashboard
- Client Dashboard
- PDF Reports
- PDF Templates
- Other
- Email Notifications
- Portfolio Management
- Integrations
- Google Analytics
- Search Console
- Pay Per Click
- WeDevelop
- API
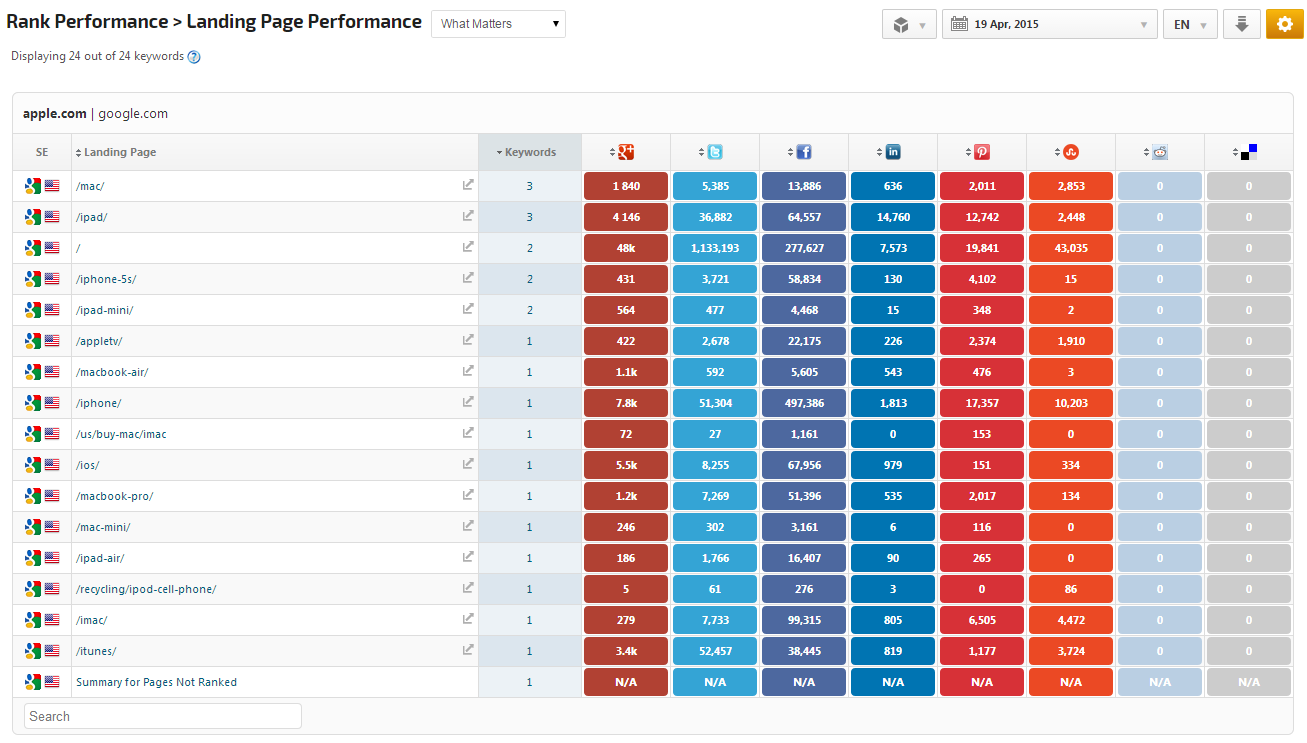
Landing Page Performance Report
Located in Organic Search > Rank Tracking > Landing Pages Performance
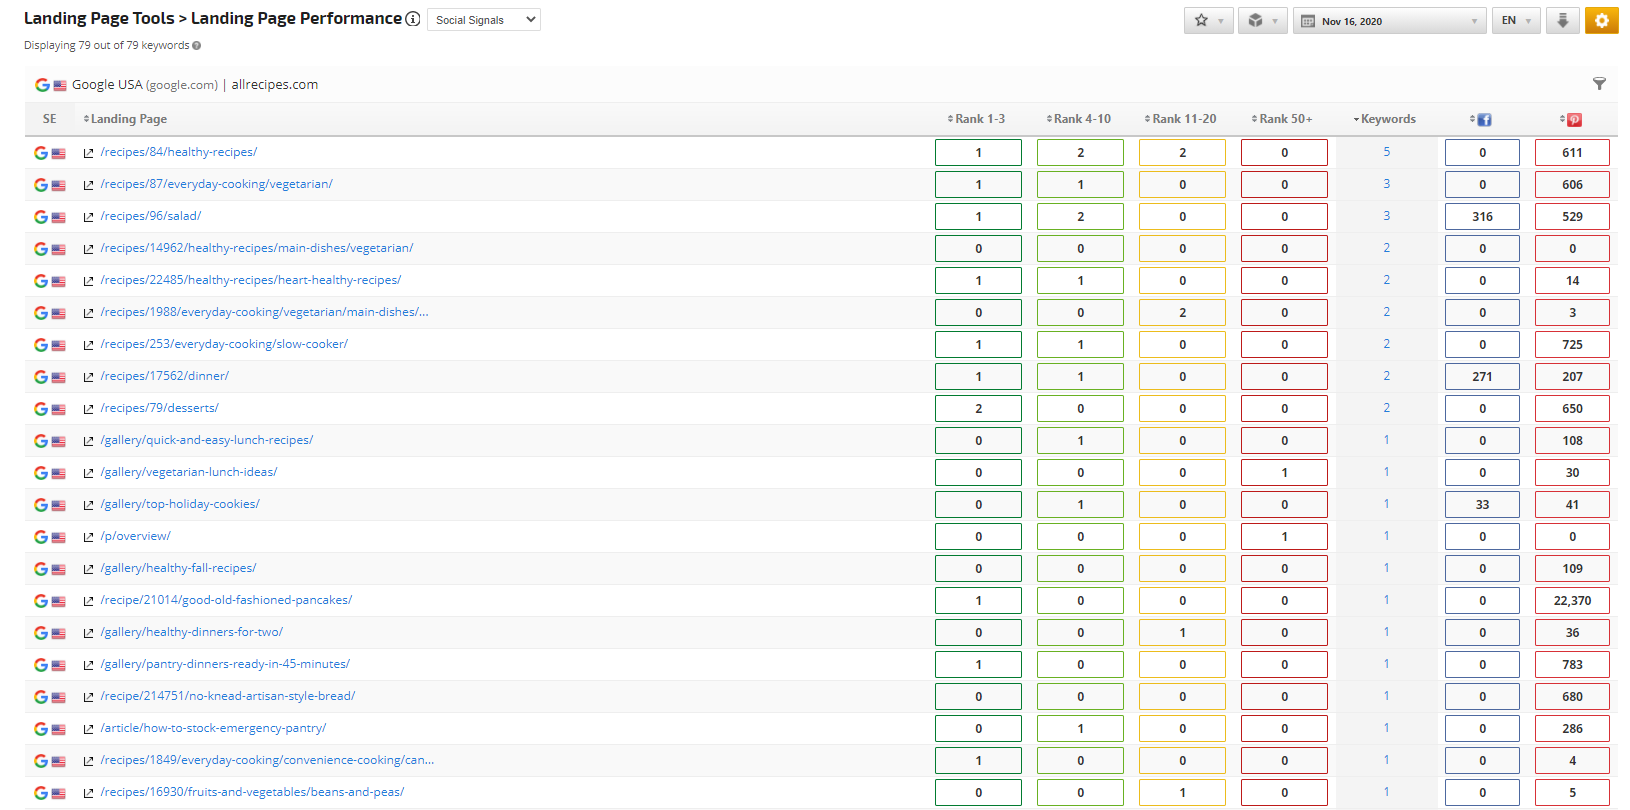
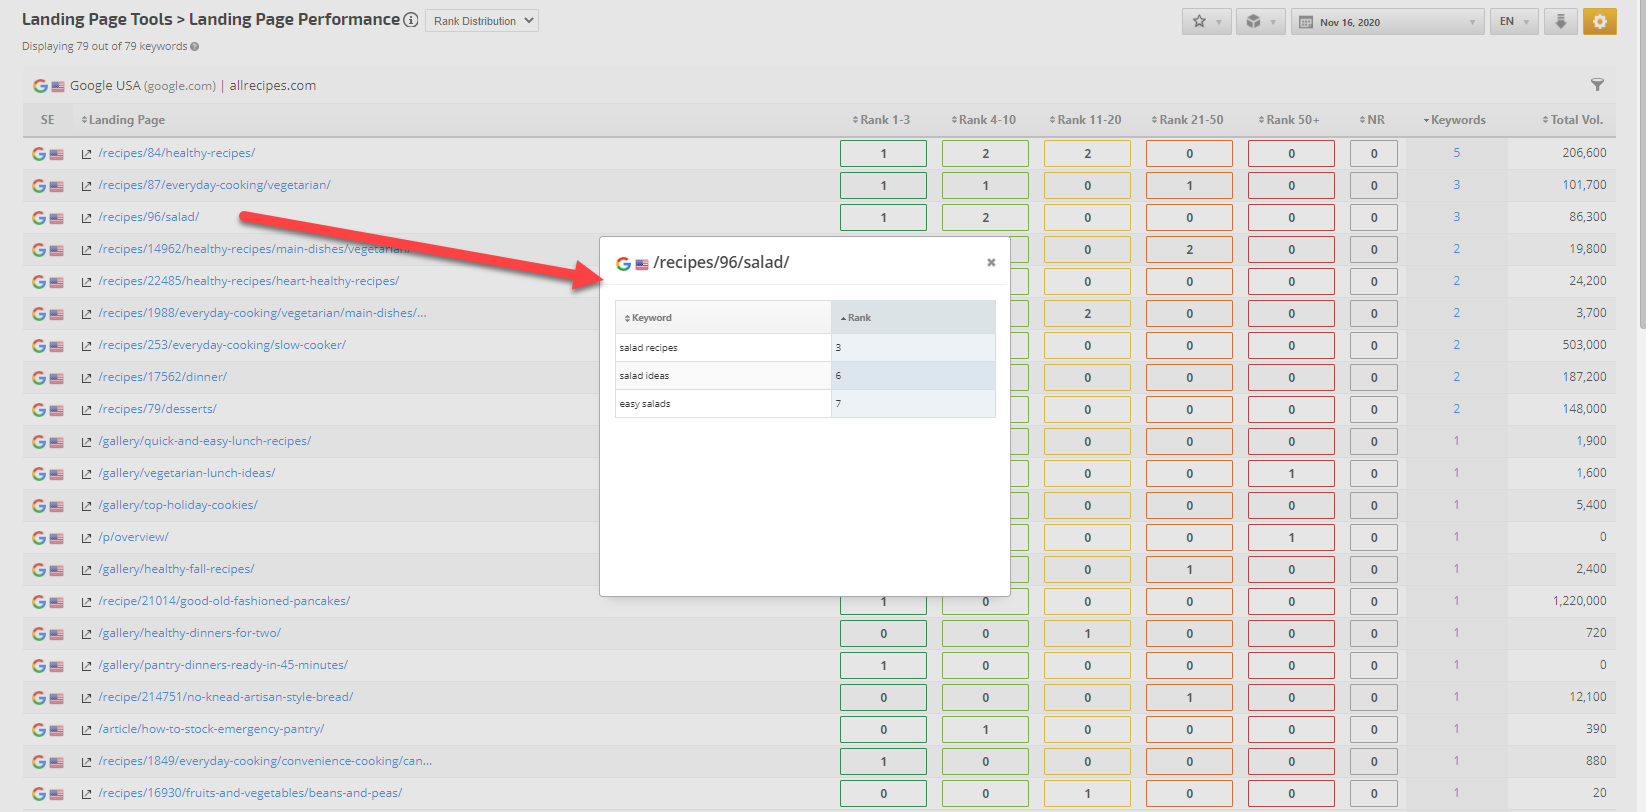
Landing Page Rank Distribution
Rankings are grouped into value sets of Rank 1 - 3; Rank 4 - 10; Rank 11 - 20 (page 2); Rank 21 - 50; Rank 50+ and NR (No Rank) and can be viewed for all or only specific Search Engines being tracked in a campaign.
In case several Target URLs are assigned to one keyword and more then one URL ranked with the given keyword, then the keyword with the highest rank will show with the associated URL. However, for the YouTube Search Engine when a list of Target URLs are assigned to keywords, all URLs with ranked keywords will be reported.
Click the Landing Page link or number in the Keywords column to view the Keywords that ranked for a specific page.
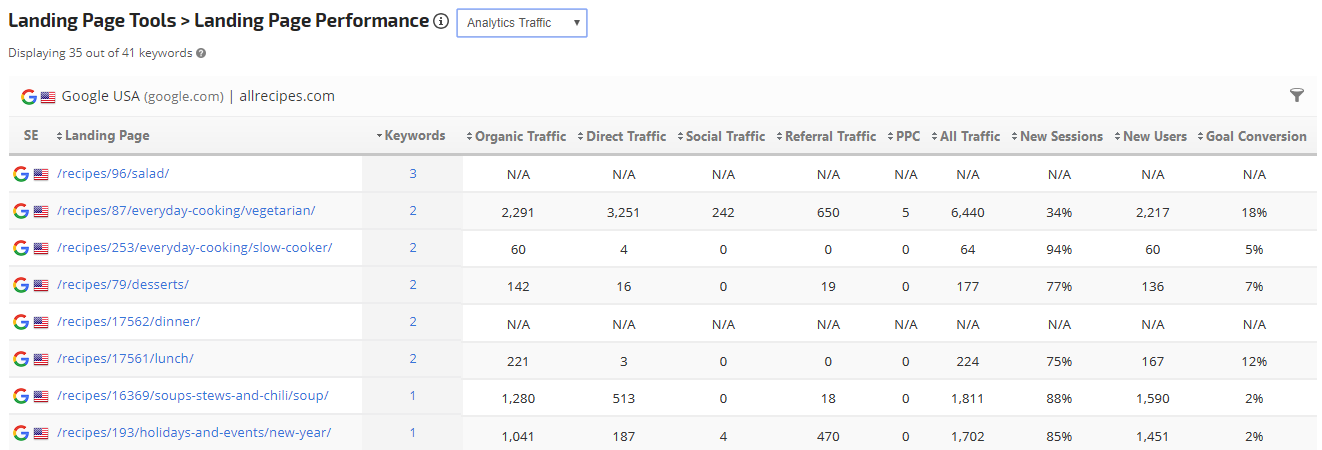
Once Google Analytics has been integrated with your Rank Ranger account, traffic data can be analyzed per landing page in this report to give a better understanding of the success of specific landing pages.
 |
Date:
|
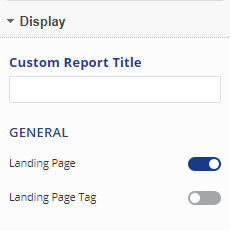 |
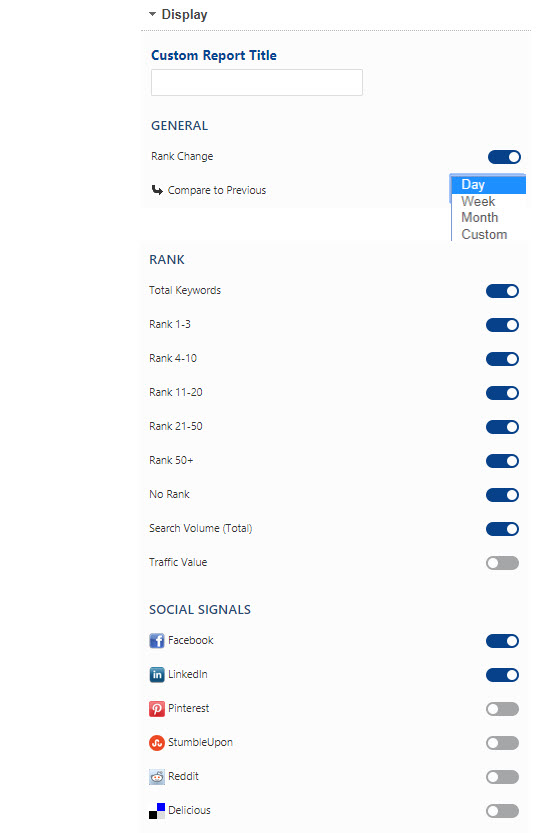
Display |
Display Rank Columns
|
|
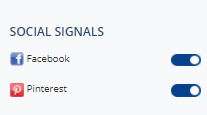 |
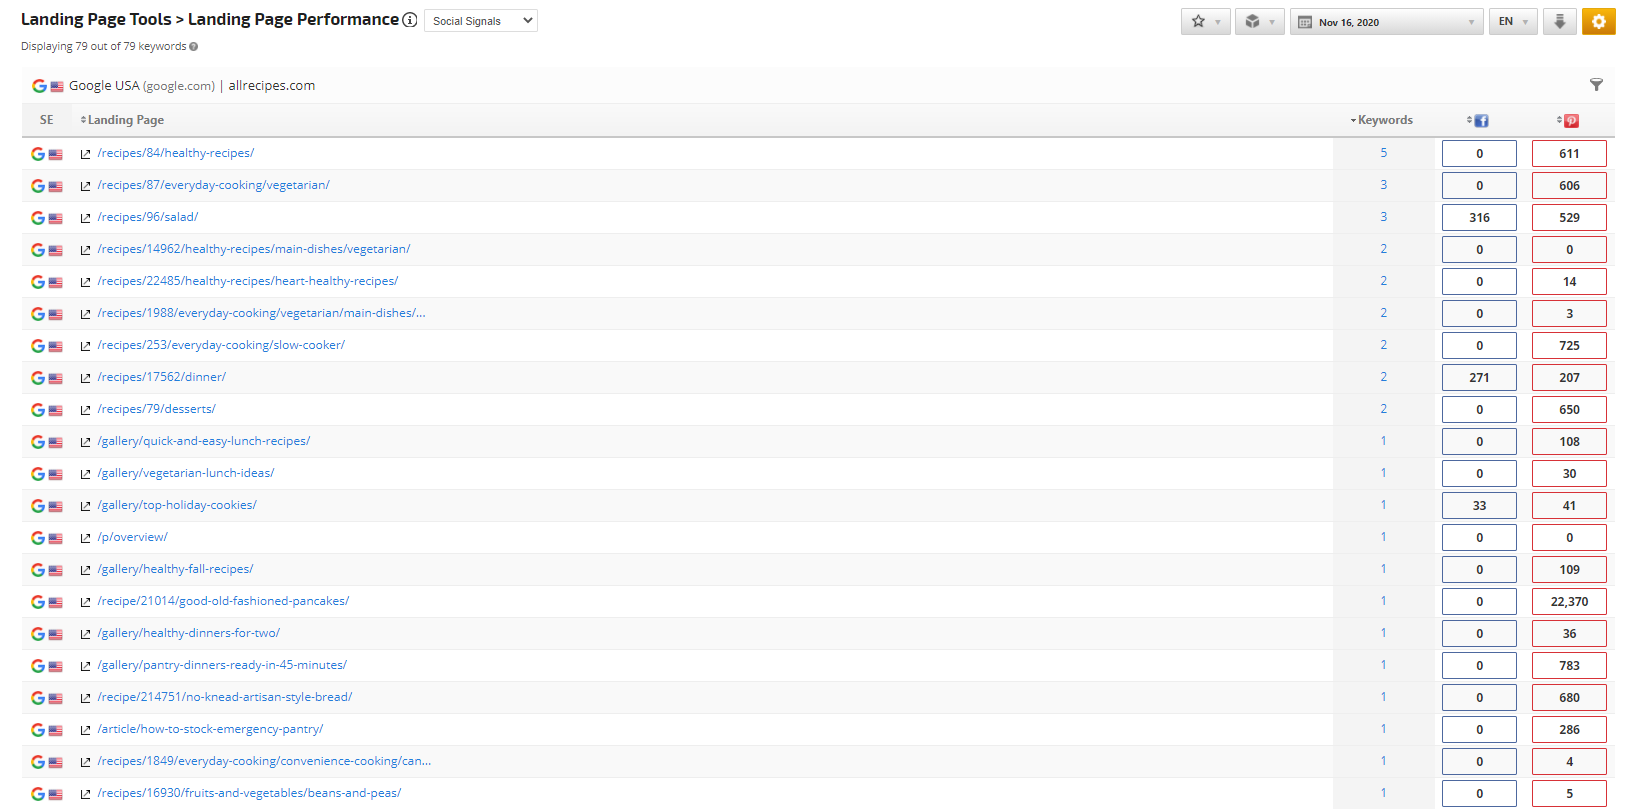
Display Social Signals
|
Sort Options
|
|
 |
Keywords
|
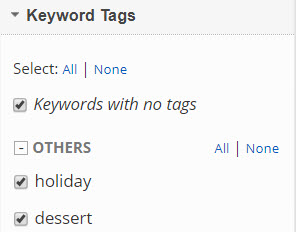 |
Keyword Tags
Important: Refer to Tag Manager for more information about creating Keyword Tag Groups and Tag Options. |
 |
Websites:
|
Search Engines
|
|
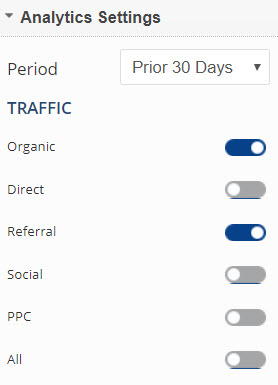 |
Analytics SettingsTraffic:
|
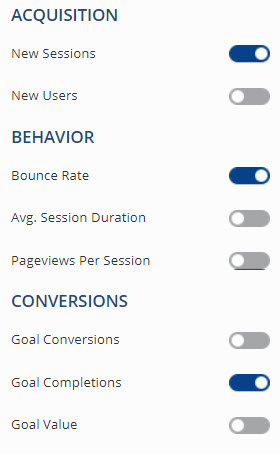 |
Acquisition
Behavior
Conversions
|
 |
Save
|
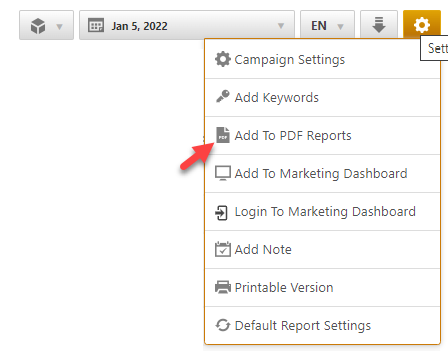
Add to PDF Report
Conveniently add a report or graph with its current settings to a PDF report by hovering over the gold gear icon and selecting Add to PDF Reports
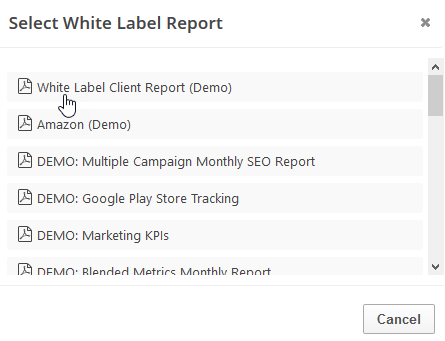
Select the PDF Report that you want the report or graph added to
Drag the new report or graph into the position you want it to display in the PDF and confirm that the Date settings do not conflict with the automated scheduling settings.
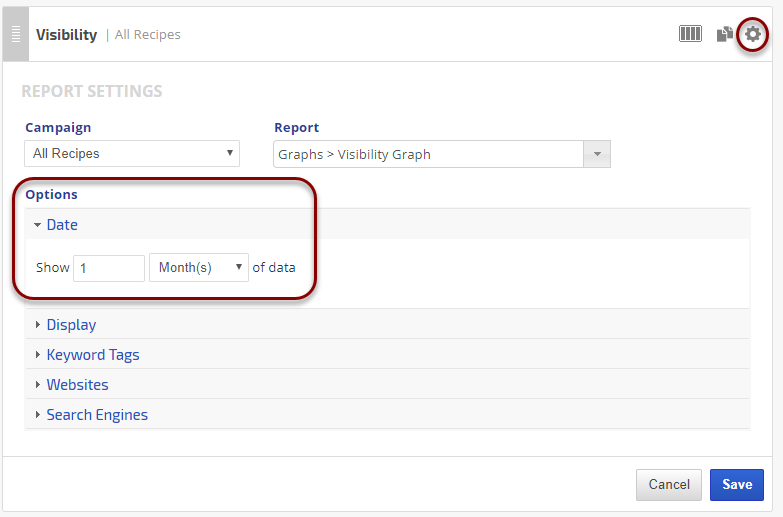
PDF Report Settings - Landing Page Performance
Reports and graphs can be added to automated PDF reports via the report screen (as described above) or manually in the PDF Report Content screen. If the report is added via the:
- report screen, then begin by clicking the Edit button corresponding to the report
- PDF Report Content screen, then click the Add Report button and select the Campaign name and Report: Landing Page Performance.
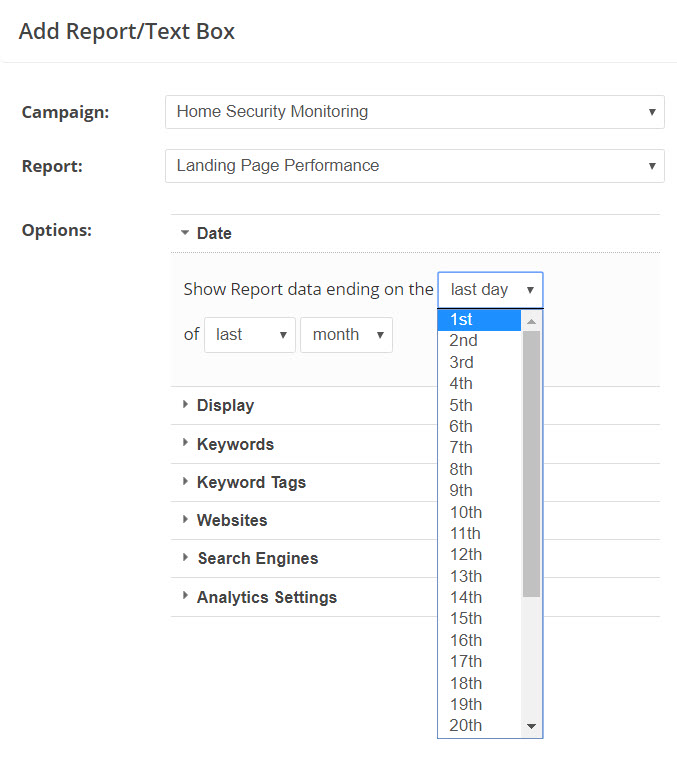 |
DateIn the Show Report data ending on the field select one of the following options:
|
 |
Display |
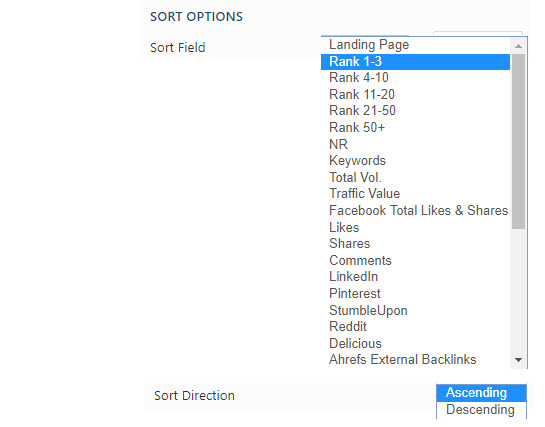 |
Sort Options
|
|
|
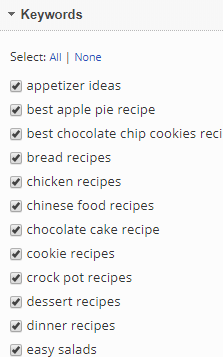
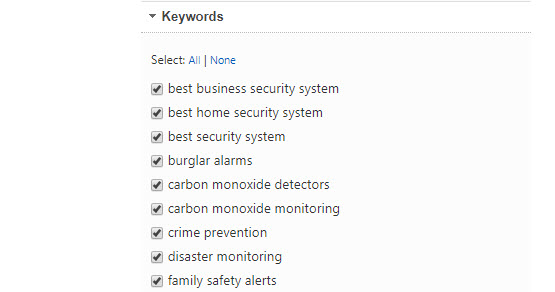
KeywordsSelect the Keywords you want displayed in the report (use the All or None link for quick selection). |
|
|
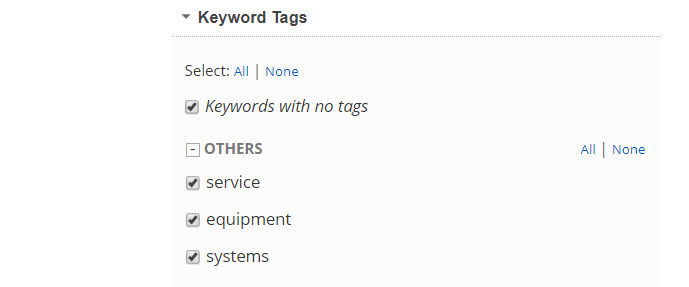
TagsSelect the Keyword Tag(s) to filter the report results by: use the All or None link for quick selection or individually check the boxes beside the keyword tags to be included in the report. . |
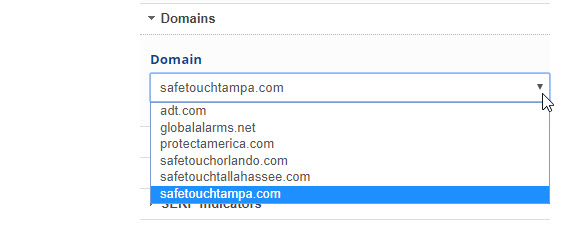 |
WebsitesSelect the Domain you want displayed in this report. |
|
|
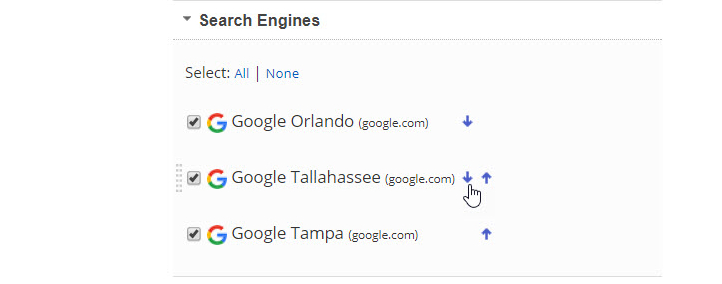
Search EnginesSelect the Search Engines to display in the report. If multiple Search Engines are selected, you have the option to change the display order by clicking the arrow next to the Search Engine and dragging it into the desired order. |
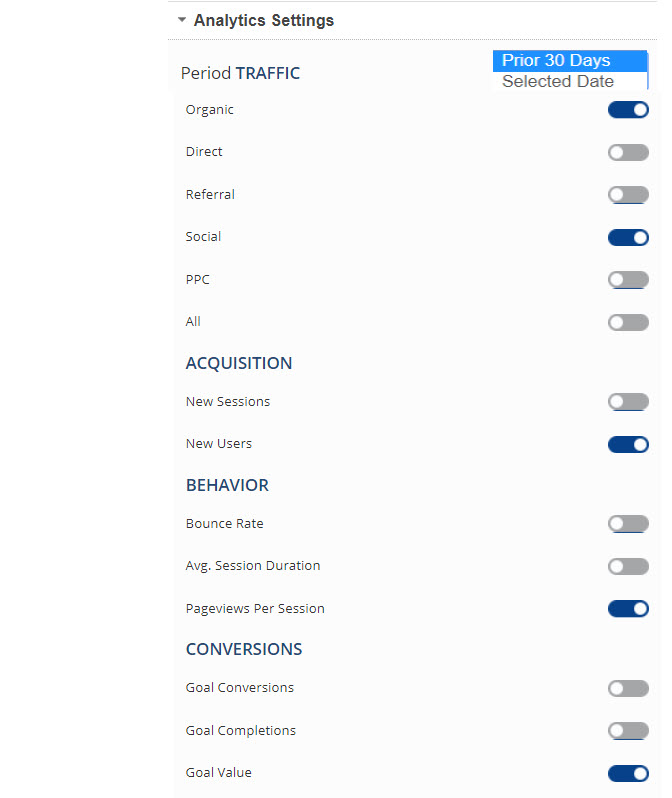 |
Analytics Settings |
Add to Marketing Dashboard
Conveniently add a report or graph with its current settings to a marketing dashboard:
1. Hover over the gold gear icon and select Add to Marketing Dashboard
2. Select the Dashboard (campaign name)
3. Select the Dashboard Page that you want the report added to

1. Hover over the gold gear icon and select Add to Marketing Dashboard
2. Select the Dashboard (campaign name)
3. Select the Dashboard Page that you want the report added to
4. Click the "Go to Dashboard" link to further customize the report (e.g., drag it to a specific position on the page, change date settings, etc.)

Refer to the Report Options section for details regarding the display settings, filters and sort options available for this report.
The report date (or date range) is governed by the selected Dashboard date option: Date Selection or Fixed Periods, learn more...
- Daily reports default to the last day of the selected period
- Weekly and monthly reports default to 1 month of data
Add to Client Dashboard
Customize Report for Client Dashboard
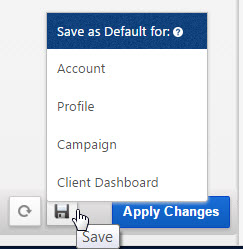
Client Dashboards display our default report options for each individual report and graph until you modify them. To customize the display of the report, expand the Report Options section, change the settings and click the Apply Changes button.
Then expand Report Options again and hover over the Save icon and select Save as Default for Client Dashboard.
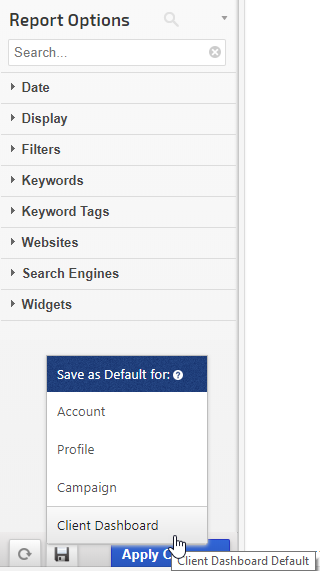
After saving the Client Dashboard default, any changes that you make to the report options will not affect the display in the Client Dashboard unless you overwrite it by following these instructions again.
Client Dashboards display our default report options for each individual report and graph until you modify them. To customize the display of the report, expand the Report Options section, change the settings and click the Apply Changes button.
Then expand Report Options again and hover over the Save icon and select Save as Default for Client Dashboard.
After saving the Client Dashboard default, any changes that you make to the report options will not affect the display in the Client Dashboard unless you overwrite it by following these instructions again.
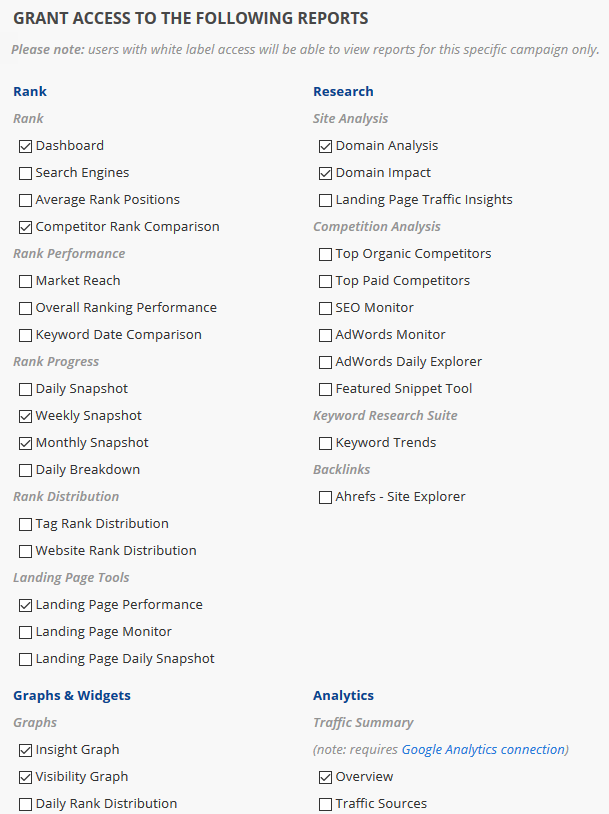
Enable the Report or Graph to display in the Client Dashboard
Open the Campaign Settings > Client Dashboard screen and check the box corresponding to the report(s) you want displayed in the dashboard, and then click the Save button.
Open the Campaign Settings > Client Dashboard screen and check the box corresponding to the report(s) you want displayed in the dashboard, and then click the Save button.
Refer to Client Dashboard Settings documentation for additional instructions for customizing your dashboard.
Rank Values Explained
The meaning of 100+, N/A, N/R, "-" and 
The three moving dots
are an indicator that rank tracking is in progress for the keywords and you should check the report later in the day for results. We do the best we can to complete the rank tracking as early as possible every day, however, there are some factors that are beyond our control (e.g., search engine response rate).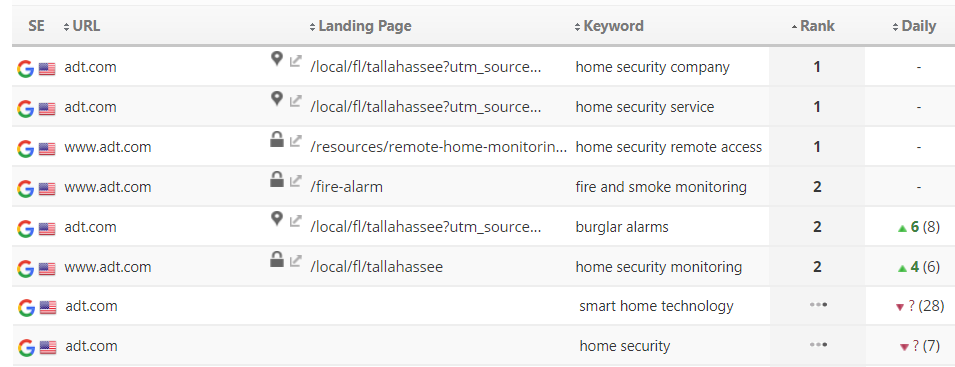
100+ is our system default for when our rank tracker did not find the keyword ranking for the primary domain within the maximum supported results tracked by each search engine (refer to our current list of supported search engines and rank depth for additional information), and the search engine did return webpages on other domains with results for the keyword.
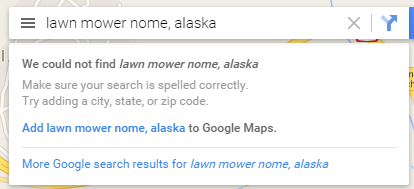 N/A means that the search engine did not return any result for the keyword, which most likely means that the keyword is not indexed by the search engine at all (e.g., the keyword "lawn mower Nome, Alaska").
 N/A is also an account-wide option that can be selected in the Theme & Localization settings to represent no rank value (e.g., instead of 100+), other options include "NR", "-", or "100+". Please check your account settings before requesting assistance for a keyword that you are certain is indexed.
If you're using one of our rank reporting APIs, they return a dash "-" in the rank field when no value is available.
No Data Found
If your account is relatively new, and depending on several variables (number of keywords, number of search engines, date range, etc.), rank reports can take anywhere from a few minutes to a 8 hours until your first reports will display all of the data. In the case of a campaign that is a day or more old, incorrect campaign configuration can lead to empty reports as well. Clicking the Default Report Settings button usually resolves the issue.
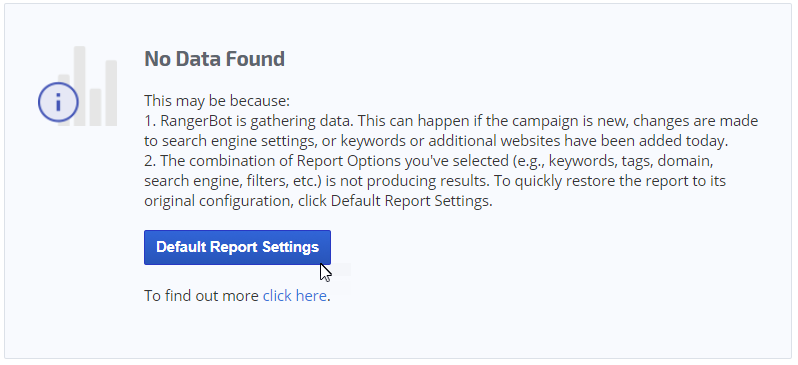
Common causes for 'no data found' message:
- Account is new and our rank tracker is gathering data
- Invalid date range (e.g., the report start date is older than the campaign creation date)
- Keyword / URL combination on report options was not found
- within the maximum supported results tracked by each search engine (refer to our current list of supported search engines and rank depth for additional information). Note that this is relevant only for rank reports and graphs.
- Incomplete campaign setup (missing URL / Keywords / Search Engines / Authorized Connections)
- Website is new and hasn't been indexed by search engines yet
- Authorized connection to a third party data provider has expired or been configured incorrectly (refer to the third party integration or webmaster tool documentation)
- Delays or outage of third party data provider (e.g., Google, Facebook, Twitter, etc.)
If keywords are missing completely from a rank report, there are 2 possibilities:
- New keywords may have been added to the campaign, but not selected. Learn more...
- The search engine did not return any result for the keyword on any domain. In some rank reports, Rank Ranger will not display keywords for which the search engine displays no results - meaning no results for any URL on the web. So if Google.com has results, but Google Mobile does not, you will see results for the keyword in the Google.com table, but the keyword will not display at all in the Google Mobile table. That is the way the system is designed because it needs a response from the search engine in order to record a number and when there is no response, then there is no number.
If you need assistance after reviewing and trying the options listed above, please contact our technical support team.