The Google Search Console Chart / List widget provides a colorful graphic presentation of search metrics from the website's Google Search Console account. A variety of display options include color palette, pie chart, column chart, map, and table list. Dimension options include country, device, page, and query. Metric options include average position, clicks, CTR or impressions. A compare to past option allows for additional analysis of either data value or percentage.
This widget can be added to white label marketing dashboards, client dashboards and PDF reports. In marketing dashboards you can set it to display at half or full page width. You can view a marketing dashboard sample that contains this and additional widgets (password is demo).
Important! In order to utilize this widget, you must integrate the website's Google Search Console account.
- SEO
- Rank Tracker
- Local SEO
- Mobile SEO
- Link Manager
- Landing Pages
- Social Signals
- On-Page Optimization
- Enterprise SEO Solutions
- Marketing
- Competition Analysis
- Insight Graph
- Keyword Research
- Graphs & Widgets
- Market Reach
- Marketing KPI
- Brand Visibility
- White Label SEO
- Marketing Dashboard
- Client Dashboard
- PDF Reports
- PDF Templates
- Other
- Email Notifications
- Portfolio Management
- Integrations
- Google Analytics
- Search Console
- Pay Per Click
- WeDevelop
- API
Google Search Console Chart / List Widget
Reports > Organic Search > Webmaster Tools
When the Country dimension is selected, there are 2 graphic display options available: world map or pie chart.
Search Console Impressions by Country with Map
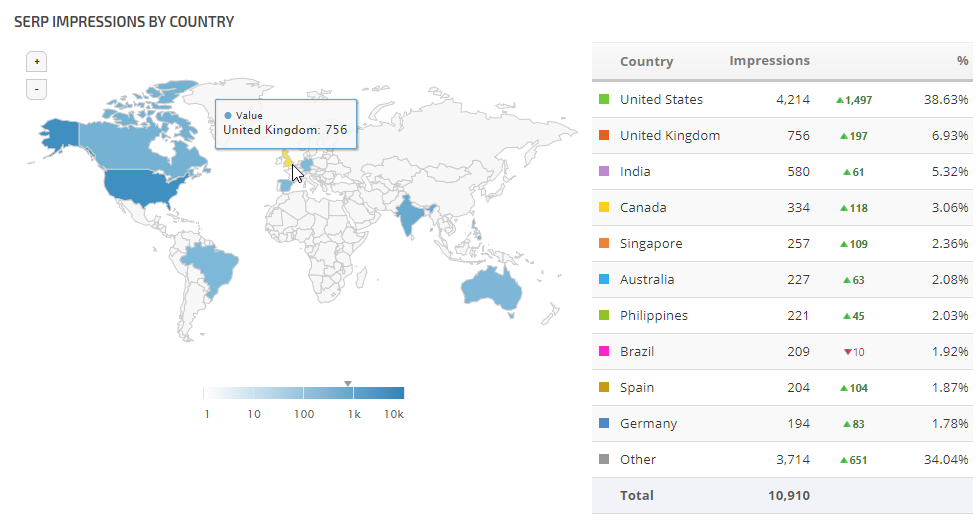
Search Console Impressions by Country with Map
Settings used to create this widget:
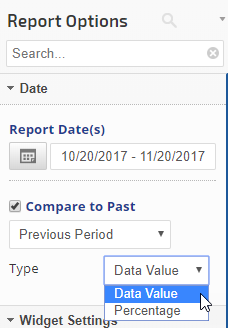
Date Settings
Date Settings
- Compare to Past: Previous Period
- Type: Data Value
- Widget Title
- Limit Results: 10
- Color Palette: Bright Tones
- Chart: enabled
- Chart Height: 400
- Table: enabled
- Titles Row: enabled
- Percentage Column: enabled
- Totals Row: enabled
- Chart Width 60% | List Width 40%
- Dimension: Country
- Map Chart: enabled
- Metric: Impressions
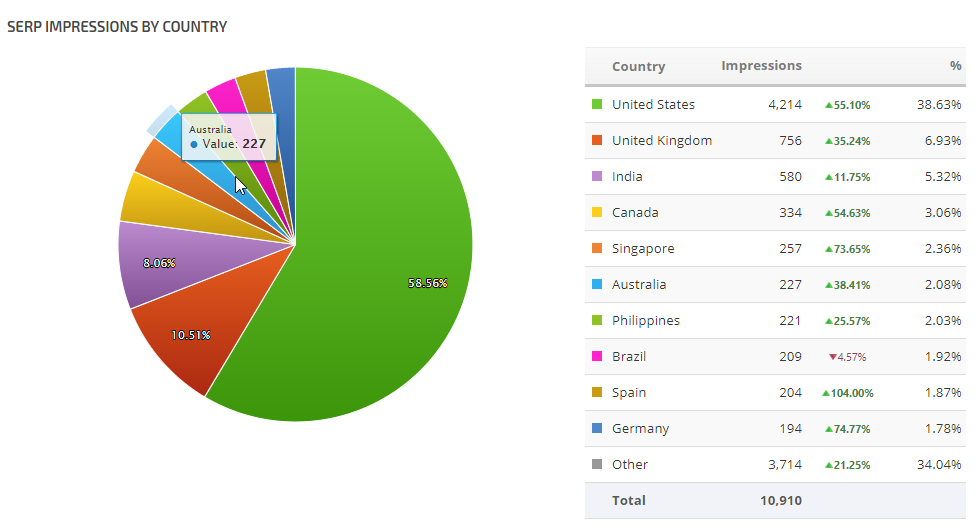
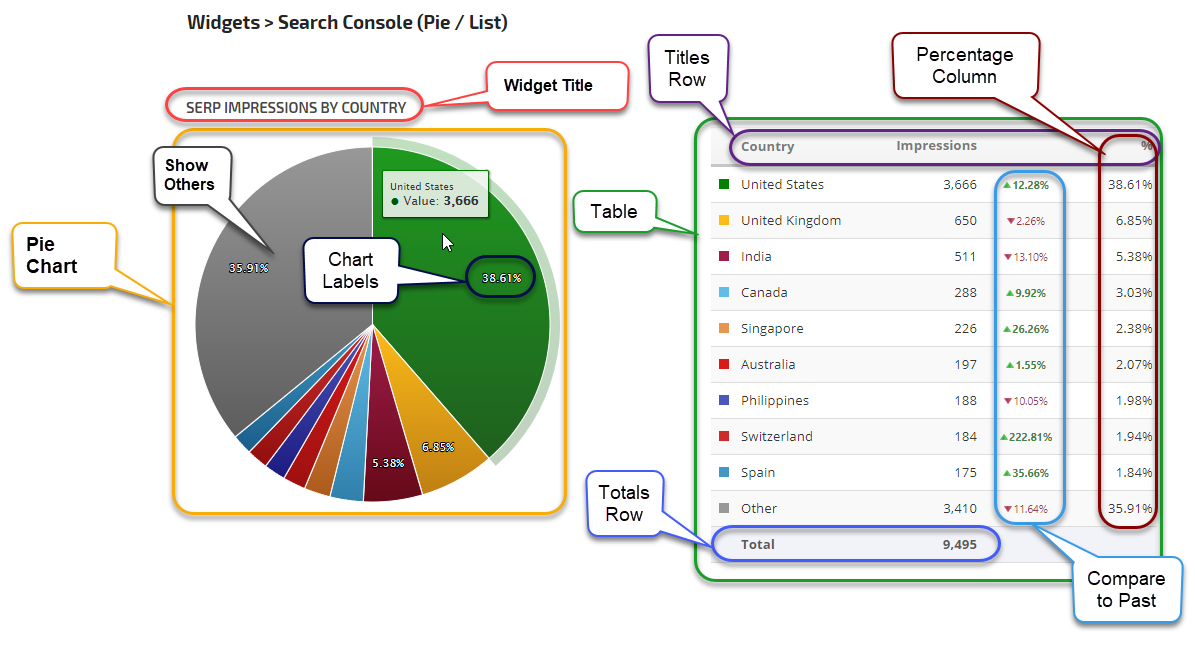
Search Console Impressions by Country with Pie Chart
Settings used to create this widget:
Date Settings
Date Settings
- Compare to Past: Previous Period
- Type: Percentage
- Widget Title
- Limit Results: 10
- Color Palette: Bright Tones
- Chart: enabled
- Chart Labels: enabled
- Show Others: disabled
- Chart Height: 400
- Table: enabled
- Titles Row: enabled
- Percentage Column: enabled
- Totals Row: enabled
- Chart Width 60% | List Width 40%
- Dimension: Country
- Map Chart: disabled
- Metric: Impressions
CTR per Device Breakdown
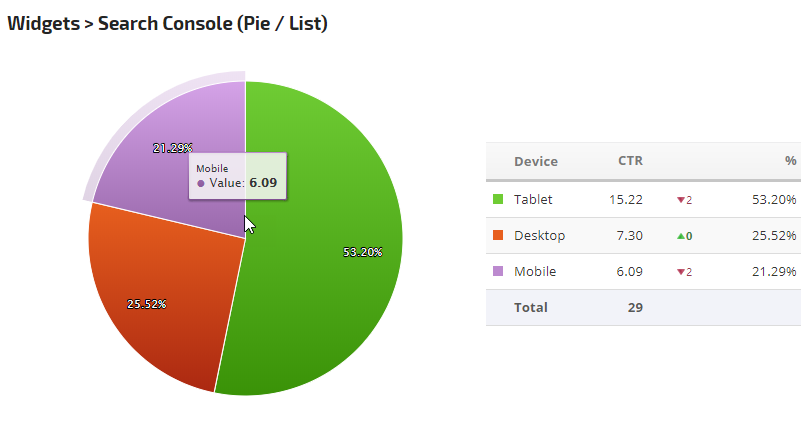
Settings used to create this widget:
Date Settings
Date Settings
- Compare to Past: Previous Period
- Type: Data Value
- Color Palette: Bright Tones
- Chart: enabled
- Chart Labels: enabled
- Show Others: disabled
- Chart Height: 350
- Table: enabled
- Titles Row: enabled
- Percentage Column: enabled
- Totals Row: enabled
- Chart Width 65% | List Width 35%
- Dimension: Device
- Metric: CTR
Page Impressions Compared to Previous Period
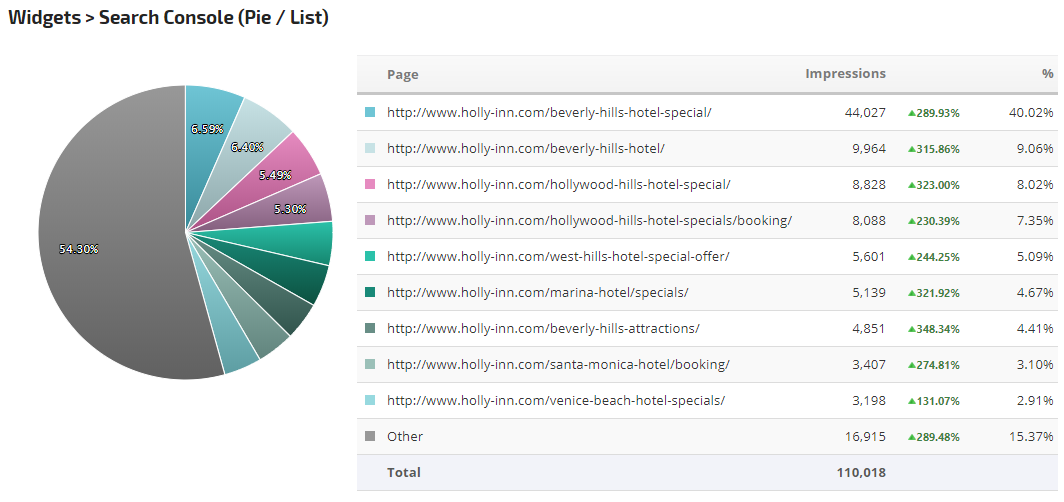
Settings used to create this widget:
Date Settings
Date Settings
- Compare to Past: Previous Period
- Type: Percentage
- Limit Results: 10
- Color Palette: Aqua
- Chart: enabled
- Chart Labels: enabled
- Show Others: ebabled
- Chart Height: 400
- Table: enabled
- Titles Row: enabled
- Percentage Column: enabled
- Totals Row: enabled
- Chart Width 40% | List Width 60%
- Dimension: Pages
- Metric: Impressions
Query Average Position
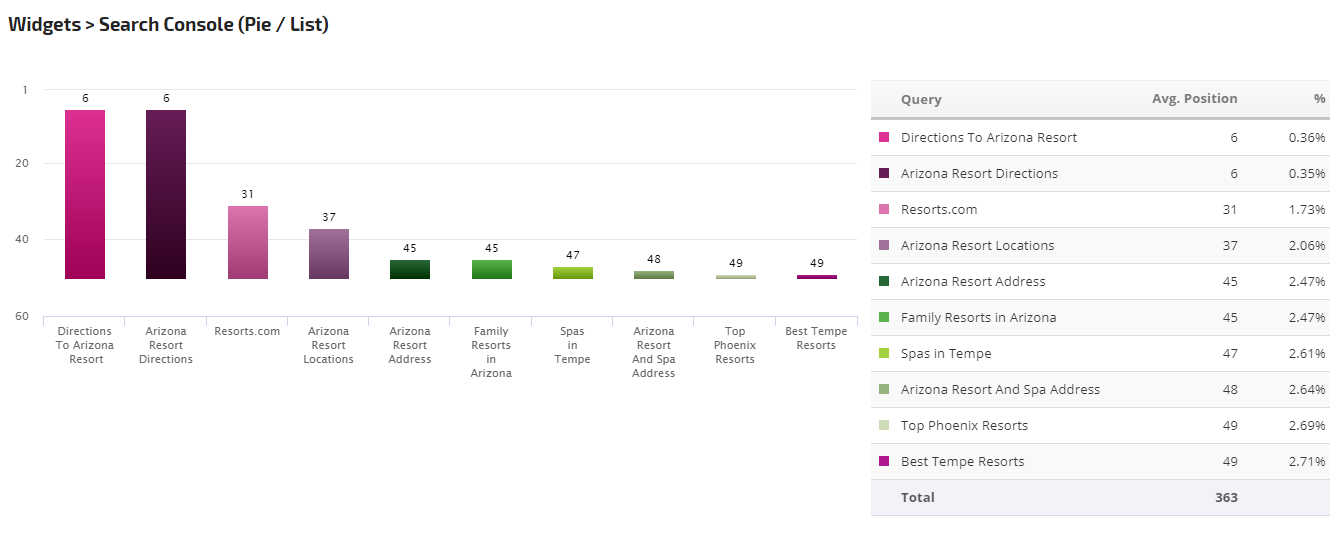
Settings used to create this widget:
Date Settings
Date Settings
- Compare to Past: disabled
- Limit Results: 10
- Color Palette: Rose Garden
- Chart: enabled
- Chart Height: 400
- Table: enabled
- Titles Row: enabled
- Percentage Column: enabled
- Totals Row: enabled
- Chart Width 70% | List Width 30%
- Dimension: Query
- Metric: Avg. Position
Query Clicks
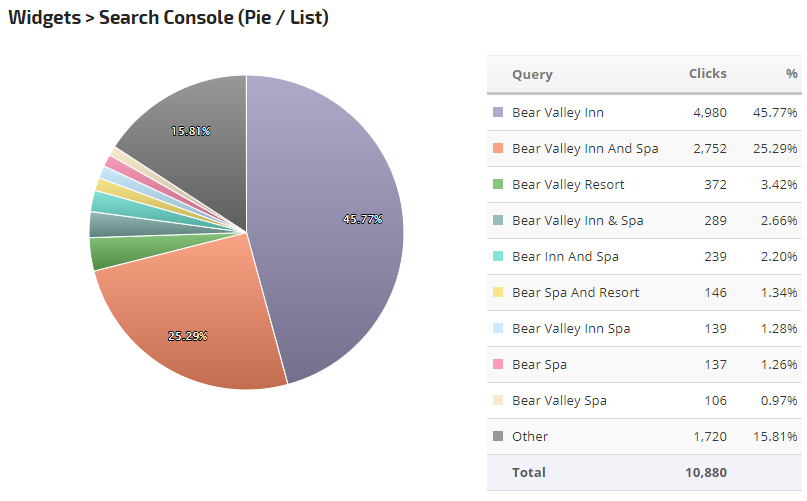
Settings used to create this widget:
Date Settings
Date Settings
- Compare to Past: disabled
- Limit Results: 10
- Color Palette: Pastels
- Chart: enabled
- Chart Labels: enabled
- Show Others: enabled
- Chart Height: 400
- Table: enabled
- Titles Row: enabled
- Percentage Column: enabled
- Totals Row: enabled
- Chart Width 65% | List Width 35%
- Dimension: Queries
- Metric: Clicks
Customize Search Console Pie / List
In Report Options, you'll find the flexibility to customize the color scheme and display columns, in addition to dimension and metric combinations.
In Report Options, you'll find the flexibility to customize the color scheme and display columns, in addition to dimension and metric combinations.
 |
Date
|
 |
Widget Settings
|
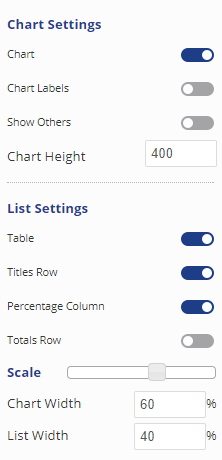 |
Chart Settings
List SettingsShow or Hide:
ScaleMove the slider to set the scale for ratio of chart width and list width |
 |
Search Console DimensionSelect a dimension
|
 |
Search Console MetricSelect a metric
|
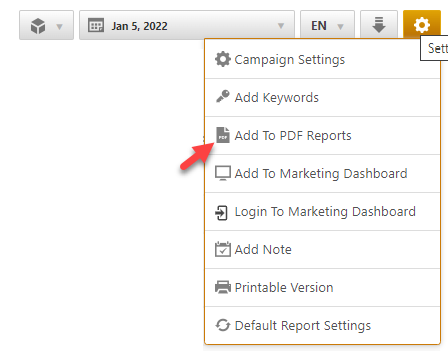
Add to PDF Report
Conveniently add a report or graph with its current settings to a PDF report by hovering over the gold gear icon and selecting Add to PDF Reports
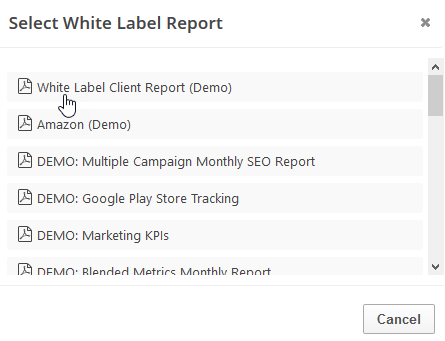
Select the PDF Report that you want the report or graph added to
Drag the new report or graph into the position you want it to display in the PDF and confirm that the Date settings do not conflict with the automated scheduling settings.
PDF Report Settings - Search Console (Chart / List)
Reports and graphs can be added to automated PDF reports via the report screen (as described above) or manually in the PDF Report Content screen. If the report is added via the:
- report screen, then begin by clicking the Edit button corresponding to the report
- PDF Report Content screen, then click the Add Report button and select the Campaign name and Report: Search Console Pie / List.
 |
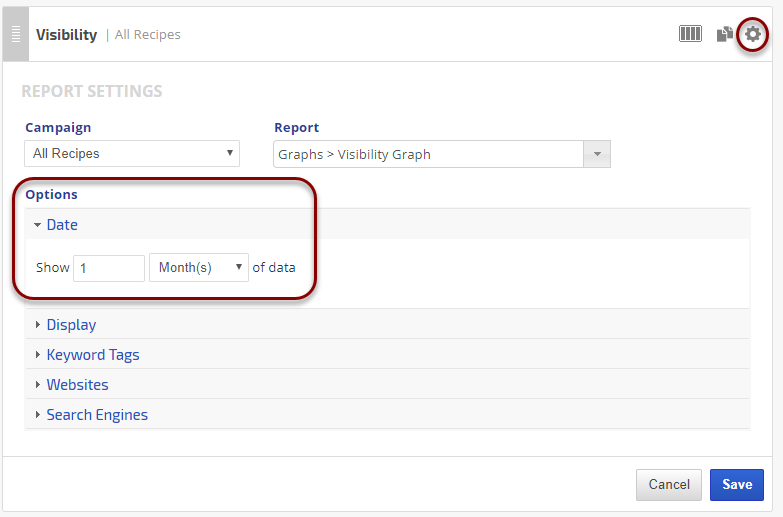
DateExpand the Date Options section and in the Show Report date of the last field type in the number of periods to be displayed in the report. In the next field select one of the following options:
If Compare to Past is checked, select one a time period from the dropdown menu:
The Date selection must produce a logical date setting based on the PDF report's automated scheduling (at the bottom of the Report Details screen). For example:
If the report is scheduled to be sent every Monday, then the following example would be invalid:
|
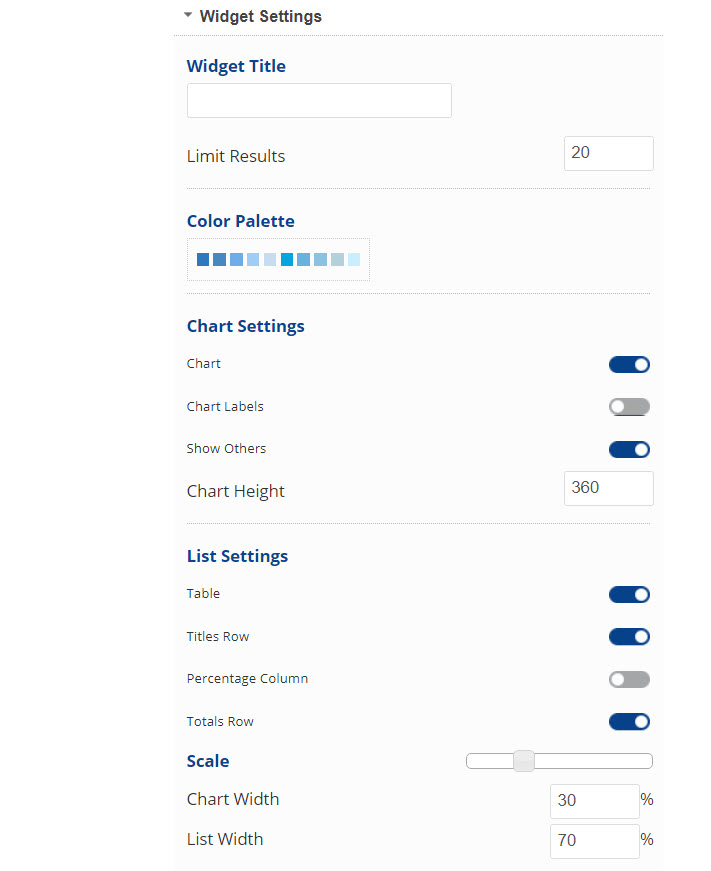 |
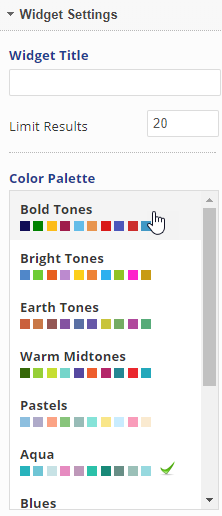
Widget SettingsEnter a Widget Title to describe your widget content (optional). Limit Results by entering the number of results you want detailed in the graph. Click on the Color Palette to expand the menu and make a selection. Expand Chart Settings by moving the slider to the right of Chart. Include options by moving the slider to the right of each selection. Enter a number for a preferred Chart Height. Expand List Settings by moving the slider to the right of Table. Include options by moving the slider to the right of each selection. Adjust the Scale for ratio of Chart Width and List Width by moving the slider. |
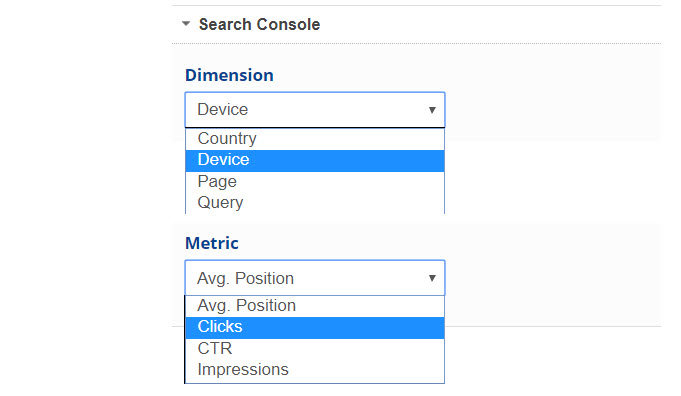 |
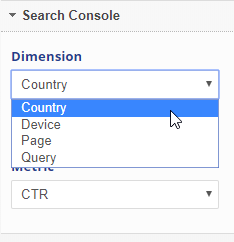
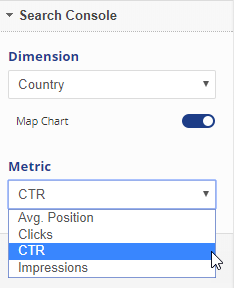
Search ConsoleSelect a Dimension from the dropdown menu. Select a Metric from the dropdown menu. |
Add to Marketing Dashboard
Conveniently add a report or graph with its current settings to a marketing dashboard:
1. Hover over the gold gear icon and select Add to Marketing Dashboard
2. Select the Dashboard (campaign name)
3. Select the Dashboard Page that you want the report added to

1. Hover over the gold gear icon and select Add to Marketing Dashboard
2. Select the Dashboard (campaign name)
3. Select the Dashboard Page that you want the report added to
4. Click the "Go to Dashboard" link to further customize the report (e.g., drag it to a specific position on the page, change date settings, etc.)

Refer to the Report Options section for details regarding the display settings, filters and sort options available for this report.
The report date (or date range) is governed by the selected Dashboard date option: Date Selection or Fixed Periods, learn more...
- Daily reports default to the last day of the selected period
- Weekly and monthly reports default to 1 month of data
Add to Client Dashboard
Customize Report for Client Dashboard
Client Dashboards display our default report options for each individual report and graph until you modify them. To customize the display of the report, expand the Report Options section, change the settings and click the Apply Changes button.
Then expand Report Options again and hover over the Save icon and select Save as Default for Client Dashboard.
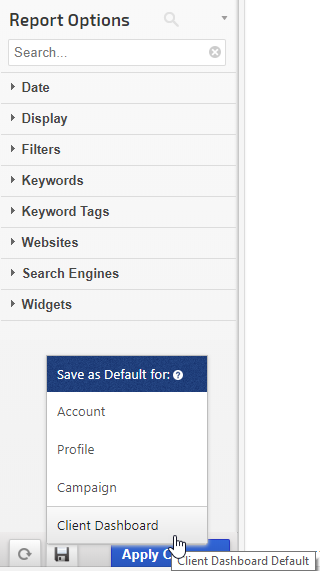
After saving the Client Dashboard default, any changes that you make to the report options will not affect the display in the Client Dashboard unless you overwrite it by following these instructions again.
Client Dashboards display our default report options for each individual report and graph until you modify them. To customize the display of the report, expand the Report Options section, change the settings and click the Apply Changes button.
Then expand Report Options again and hover over the Save icon and select Save as Default for Client Dashboard.
After saving the Client Dashboard default, any changes that you make to the report options will not affect the display in the Client Dashboard unless you overwrite it by following these instructions again.
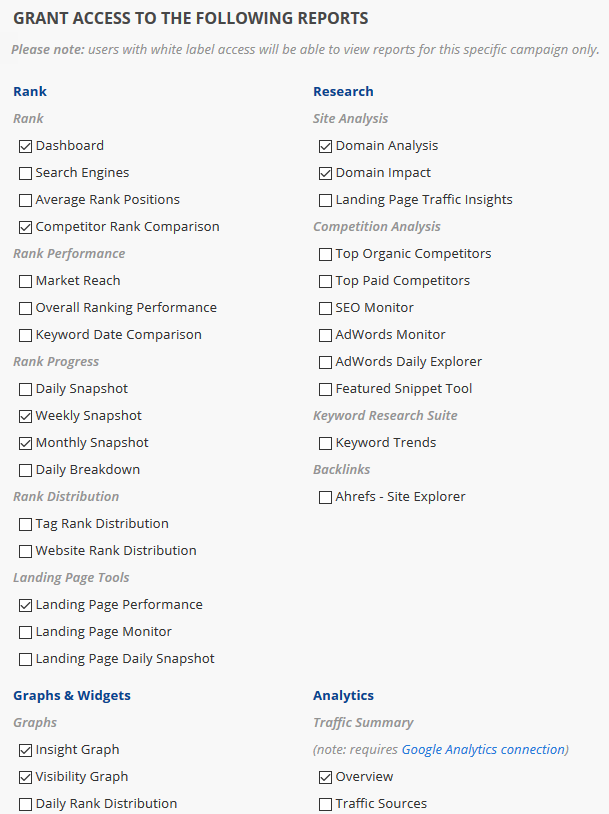
Enable the Report or Graph to display in the Client Dashboard
Open the Campaign Settings > Client Dashboard screen and check the box corresponding to the report(s) you want displayed in the dashboard, and then click the Save button.
Open the Campaign Settings > Client Dashboard screen and check the box corresponding to the report(s) you want displayed in the dashboard, and then click the Save button.
Refer to Client Dashboard Settings documentation for additional instructions for customizing your dashboard.